Modulation of reactive oxygen species in skeletal muscle by myostatin is mediated through NF-κB - PubMed (original) (raw)
Modulation of reactive oxygen species in skeletal muscle by myostatin is mediated through NF-κB
Sandhya Sriram et al. Aging Cell. 2011 Dec.
Erratum in
- Erratum.
[No authors listed] [No authors listed] Aging Cell. 2016 Oct;15(5):981-2. doi: 10.1111/acel.12457. Aging Cell. 2016. PMID: 27599757 Free PMC article. No abstract available.
Abstract
Abnormal levels of reactive oxygen species (ROS) and inflammatory cytokines have been observed in the skeletal muscle during muscle wasting including sarcopenia. However, the mechanisms that signal ROS production and prolonged maintenance of ROS levels during muscle wasting are not fully understood. Here, we show that myostatin (Mstn) is a pro-oxidant and signals the generation of ROS in muscle cells. Myostatin, a transforming growth factor-β (TGF-β) family member, has been shown to play an important role in skeletal muscle wasting by increasing protein degradation. Our results here show that Mstn induces oxidative stress by producing ROS in skeletal muscle cells through tumor necrosis factor-α (TNF-α) signaling via NF-κB and NADPH oxidase. Aged Mstn null (Mstn(-/-) ) muscles, which display reduced sarcopenia, also show an increased basal antioxidant enzyme (AOE) levels and lower NF-κB levels indicating efficient scavenging of excess ROS. Additionally, our results indicate that both TNF-α and hydrogen peroxide (H(2) O(2) ) are potent inducers of Mstn and require NF-κB signaling for Mstn induction. These results demonstrate that Mstn and TNF-α are components of a feed forward loop in which Mstn triggers the generation of second messenger ROS, mediated by TNF-α and NADPH oxidase, and the elevated TNF-α in turn stimulates Mstn expression. Higher levels of Mstn in turn induce muscle wasting by activating proteasomal-mediated catabolism of intracellular proteins. Thus, we propose that inhibition of ROS induced by Mstn could lead to reduced muscle wasting during sarcopenia.
© 2011 The Authors. Aging Cell © 2011 Blackwell Publishing Ltd/Anatomical Society of Great Britain and Ireland.
Figures
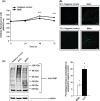
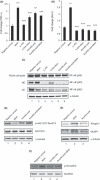
Figure 1
Myostatin (Mstn) induces reactive oxygen species (ROS) in C2C12 myoblasts. (A) ROS production was measured using a fluorescent multilabel plate reader in differentiating C2C12 cells treated with Mstn (3.5 ng mL−1) using a fluorescent probe, CM‐H2DCFDA (Molecular Probes). The graph shows relative intensities expressed as arbitrary fluorescent units. ROS production is significantly increased (***P < 0.001) upon Mstn treatment during differentiation when compared to the untreated cells (n = 4). (B) ROS production was also measured in Mstn‐treated C2C12 cells in Permanox chamber slides. The fluorescence was viewed under the Leica upright microscope, and images were taken at 10× magnification. Increased fluorescence (green) intensity is directly proportional to increased ROS production in cells (n = 4). (C) Effect of Mstn and H2O2 on protein carbonylation in C2C12 myoblasts. Left panel – representative gel showing the increased protein carbonylation in H2O2 (0.05 m
m
) or Mstn (3.5 ng mL−1) treated C2C12 cells as detected by Oxyblot assay kit (Millipore Corp.). Right panel – corresponding densitometry analysis of the blot showing the percentage increase in carbonylation as compared to the untreated cells (*P < 0.05) (n = 2). α‐tubulin was used as an internal control for equal protein loading on the gel.
Figure 2
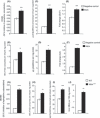
Myostatin (Mstn) up‐regulates the activity and mRNA expression of AOEs in differentiating C2C12 myoblasts. C2C12 cells were treated with Mstn (3 μg mL−1) in the differentiation media, and total cell lysates were made at indicated time points. The enzyme assays were performed for SOD (A), CAT (B), GPx (C), and GSR (D). The values are mean ± SE of four independent experiments: **P < 0.01 and ***P < 0.001 when compared to the negative control (n = 4). C2C12 cells were treated with Mstn (3.5 ng mL−1) and gene expression analysis was performed for Sod1 and Cat. The values are mean ± SE of four independent experiments. An increase in gene expression of Sod1 (E, ***P < 0.001) and Cat (F, ****P < 0.0001) was observed upon Mstn treatment during differentiation (n = 4). Mstn−/− primary myoblasts have elevated basal AOE levels and increased lipid peroxidation. Enzyme activities of SOD (G), CAT (H), and GPx (I) were analyzed in the total cell lysates of differentiating primary myoblasts from WT and Mstn−/− mice (8‐week old) at indicated time points. The values are given as mean ± SE of four independent experiments: **P < 0.05, ***P < 0.001, and ****P < 0.0001 denote significant increase compared to the WT primary myoblasts. (J) The lipid peroxidation was determined in the differentiating primary myoblasts at the indicated time point. The values are given as nmoles of malonaldehyde produced and are mean ± SE of four independent experiments; **P < 0.01 denotes significant increase relative to the WT primary myoblasts.
Figure 3
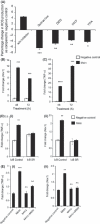
Effect of the inhibitors of NADH/NAD(P)H oxidase and enzymes of mitochondrial ETC (mETC) on myostatin (Mstn)‐induced reactive oxygen species (ROS) generation. (A) C2C12 cells were treated for 48 h with Mstn (3.5 ng mL−1) in the presence of ROS cell signaling inhibitors, and ROS content was analyzed using the fluorescent probe, CM‐H2DCFDA (Molecular Probes). Reactive oxygen species production was significantly decreased (*P < 0.05, **P < 0.01 and ***P < 0.001) in cells treated with Quinacrine, DIDS, CCCP, and TTFA when compared to the cells treated with Mstn alone (no inhibitor). The data are expressed as percentage increase or decrease in ROS production (n = 4). mRNA expression for Nox1 and tumor necrosis factor‐α (TNF‐α ) was determined in C2C12 cells treated with Mstn (3.5 ng mL−1) in differentiation media at indicated time points. The values are mean ± SE of four independent experiments. ***P < 0.001 and ****P < 0.0001 denote significant fold increase in Nox1 (B) and TNF‐α (C) mRNA expression relative to the negative control. Mstn induces ROS through TNF‐α via NF‐κB signaling. (D) Representative graph showing mRNA expression of TNF‐α (i) and Nox1 (ii) in IκB‐α control and IκB‐α‐SR‐expressing C2C12 cells which lack NF‐κB activity treated for 48 h with Mstn (3.5 ng mL−1) in proliferation media. The values are mean ± SE of two independent experiments. **P < 0.01 denotes significant increase when compared to untreated cells (n = 2). (E) Representative graph showing mRNA expression of TNF‐α (i) and Nox1 (ii) in C2C12 cells treated for 1 h with BAY11‐7085 (20 μ
m
mL−1) and for 48 h with Mstn (3.5 ng mL−1) in proliferation media. The values are mean ± SE of two independent experiments. **P < 0.01 and ***P < 0.001 denote significant increase when compared to untreated cells; ^^P < 0.01 denotes significant decrease when compared to Mstn‐treated cells (n = 2).
Figure 4
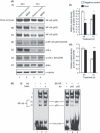
Myostatin (Mstn) induces reactive oxygen species (ROS) through tumor necrosis factor‐α (TNF‐α) via NF‐κB signaling. (A) Effect of Mstn on NF‐κB and IκB‐α in proliferating C2C12 myoblasts. Western blotting analysis was performed on whole cell lysates, nuclear and cytoplasmic extracts obtained from C2C12 cells treated with Mstn (3.5 ng mL−1) for indicated time points. (i) Left panel – representative immunoblot showing protein levels of NF‐κB (p65), p‐NF‐κB (p65), IκB‐α, p‐IκB‐α, and IKKα in negative control (Lanes 1 and 3) and Mstn (Lanes 2 and 4)‐treated whole protein lysates, nuclear and cytoplasmic extracts at indicated time points. α‐tubulin was used as an internal control for equal protein loading on the gel. Right panel – corresponding densitometry analysis of (ii) p‐NF‐κB (p65) and (iii) p‐IκB‐α showing significant increase or decrease in protein content upon Mstn treatment (*P < 0.05, **P < 0.01) (n = 2). (B) Mstn‐mediated enhancement of NF‐κB binding activity on mouse TNF‐α promoter. Electrophoretic mobility shift assay was performed using nuclear extracts from proliferating C2C12 cells treated with Mstn (3.5 ng mL−1) for 48 h. (i) Left panel – representative gel showing the increased activity of NF‐κB upon Mstn treatment. Lane 1, oligo only; Lane 2, untreated; Lane 3, Mstn treated. Electrophoretic mobility shift assay was also performed with nuclear extracts pre‐incubated with the specific antibody. (ii) Right panel – representative gel showing NF‐κB complexes containing p65 or p50 subunits. Lane 1, no antibody added; Lane 2, p65‐specific antibody added; Lane 3, p50‐specific antibody added (n = 2).
Figure 5
5‐ASA and ascorbic acid inhibit Mstn‐induced ROS via tumor necrosis factor‐α (TNF‐α) and NF‐κB signaling. mRNA expression analysis was performed on C2C12 cells treated with 5‐ASA (10 μ
m
mL−1) and ascorbic acid (100 μ
m
mL−1) along with Mstn (3 μg mL−1). Representative graphs show fold change in the mRNA expression of TNF‐α (A) and Nox1 (B). The values are mean ± SE of two independent experiments. **P < 0.01 and ***P < 0.001 denote significant increase when compared to untreated cells; ^^P < 0.01 and ^^^P < 0.001 denote significant decrease when compared to Mstn‐treated cells (n = 2). (C) Western blotting analysis showing the level of NF‐κB‐p65 at 48 h time point in whole cell lysates, nuclear and cytoplasmic extracts of proliferating C2C12 cells, untreated (Lane 1), treated with Mstn (Lane 2), 5‐ASA (Lane 3), 5‐ASA and Mstn (Lane 4), ascorbic acid (Lane 5), and ascorbic acid and Mstn (Lane 6). α‐tubulin was used as an internal control for equal protein loading on the gel. Mstn induces the muscle‐specific E3 ligase expression via ROS‐dependent pathway. Western blotting analysis showing the levels of p‐Akt and Akt (48 h) (D), Atrogin1 and MuRF1 (72 h) (E) in the C2C12 cells, untreated (Lane 1), treated with Mstn (3 μg mL−1) (Lane 2), ascorbic acid (100 μ
m
mL−1) (Lane 3), and ascorbic acid and Mstn (Lane 4,D) (n = 2). α‐tubulin was used as an internal control for equal protein loading on the gels. (F) Representative gel showing p‐Smad2/3 protein levels in C2C12 cells, untreated (Lane 1), treated with Mstn (3 μg mL−1) (Lane 2), ascorbic acid (100 μ
m
mL−1) (Lane 3), and ascorbic acid and Mstn (Lane 4) for 48 h during proliferation. GAPDH was used as an internal control for equal protein loading on the gel.
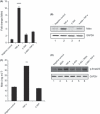
Figure 6
Tumor necrosis factor‐α (TNF‐α) induces myostatin (Mstn) expression, secretion, and signaling in a feed forward mechanism (A) Representative graph showing mRNA expression of Mstn and (B) representative gel showing protein levels of Mstn (∼56 KDa‐full length) in C2C12 cells, untreated (Lane 1), treated with TNF‐α (10 ng mL−1) (Lane 2), 5‐ASA (10 μ
m
mL−1) (Lane 3), and 5‐ASA and TNF‐α (Lane 4) for 72 h in proliferation media. The values are mean ± SE of two independent experiments. Level of significance was compared to the untreated control (****P < 0.0001) (n = 2). GAPDH was used as an internal control for equal protein loading on the gel. (C) Level of secreted Mstn in the cell culture media from C2C12 cells treated with TNF‐α (10 ng mL−1) and 5‐ASA (10 μ
m
mL−1) was determined by EIA. The values are mean ± SE of two independent experiments. The concentration of Mstn is given as ng mL−1, and the level of significance was determined with respect to the negative control (**P < 0.01) (n = 2). (D) Representative gel showing p‐Smad2/3 protein levels in C2C12 cells, untreated (Lane 1), treated with Mstn (3 μg mL−1) (Lane 2), TNF‐α (10 ng mL−1) (Lane 3), 5‐ASA (10 μ
m
mL−1) (Lane 4), 5‐ASA and Mstn (Lane 5), and 5‐ASA and TNF‐α (Lane 6) for 72 h during proliferation. GAPDH was used as an internal control for equal protein loading on the gel.
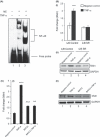
Figure 7
Tumor necrosis factor‐α (TNF‐α) induces myostatin (Mstn) expression via NF‐κB signaling. (A) TNF‐α‐mediated enhancement of NF‐κB binding on mouse Mstn promoter. Electrophoretic mobility shift assay was performed using nuclear extracts from proliferating C2C12 cells treated with TNF‐α (10 ng mL−1) for 72 h. Representative gel showing the significant increase in the binding activity of NF‐κB upon TNF‐α treatment. Lane 1, oligo only; Lane 2, untreated; Lane 3, TNF‐α treated. (B) Representative graph showing mRNA expression of Mstn (i) and representative gel showing protein levels of Mstn (ii) in IκB‐α‐SR‐expressing C2C12 cells treated for 72 h with TNF‐α (10 ng mL−1) in proliferation media; IκB‐α C (control cells) untreated (Lane 1), TNF‐α treated (Lane 2), IκB‐α SR cells untreated (Lane 3), and TNF‐α treated (Lane 4). The values are mean ± SE of two independent experiments. ***P < 0.001 denotes significant increase in mRNA expression when compared to untreated cells (n = 2). GAPDH was used as an internal control for equal protein loading on the gel. (C) Representative graph showing mRNA expression of Mstn (i) and representative gel showing protein levels of Mstn (ii) in C2C12 cells treated for 1 h with BAY11‐7085 (20 μ
m
mL−1) and for 72 h with TNF‐α (10 ng mL−1) in proliferation media; Lane 1, untreated; Lane 2, TNF‐α treated; Lane 3, BAY11‐7085 treated; and Lane 4, BAY11‐7085 and TNF‐α‐treated cells. The values are mean ± SE of two independent experiments. ****P < 0.0001 denotes significant increase in gene expression when compared to untreated cells; ^^P < 0.01 and ^^^P < 0.001 denote significant decrease in mRNA expression when compared to Mstn‐treated cells (n = 2). GAPDH was used as an internal control for equal protein loading on the gel.
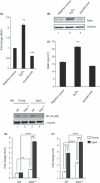
Figure 8
Hydrogen peroxide (H2O2) induces myostatin (Mstn) expression, secretion, and signaling (A) Representative graph showing mRNA expression of Mstn and (B) representative gel showing protein levels of Mstn in C2C12 cells, untreated (Lane 1), treated with H2O2 (0.05 m
m
) (Lane 2), and ascorbic acid (100 μ
m
mL−1) (Lane 3) for 72 h in proliferation media. The values are mean ± SE of two independent experiments. Significant increase (**P < 0.01) or decrease (***P < 0.001) in mRNA expression was compared to the untreated control (n = 2). GAPDH was used as an internal control for equal protein loading on the gel. (C) Level of secreted Mstn in the cell culture media from C2C12 cells treated with H2O2 (0.05 m
m
) and ascorbic acid (100 μ
m
mL−1) was determined by EIA. The values are mean ± SE of two independent experiments. The concentration of Mstn is given as ng mL−1, and the level of significance was determined with respect to the negative control (**P < 0.01) (n = 2). Absence of Mstn during aging decreases NF‐κB levels and increases AOE gene expression in skeletal muscle. Western blotting analysis showing the level of NF‐κB‐p65 in protein lysates from Gas muscle of young (6‐week old) and aged (2‐year old) WT and Mstn−/− mice; young WT (Lane 1), young Mstn−/− (Lane 2), aged WT (Lane 3), and aged Mstn−/− (Lane 4). α‐tubulin was used as an internal control for equal protein loading on the gel. mRNA expression analysis in Gas muscle from young and aged WT and Mstn−/− mice was performed. Representative graphs show fold change in the mRNA expression of Sod1 (E) and Cat (F). The values are mean ± SE of three independent experiments. **P < 0.01, ***P < 0.001, and ****P < 0.0001 denote significant increase when compared to young and aged mice, and ^^^^P < 0.0001 denotes significant increase when compared to WT and Mstn−/− mice (n = 3).
Figure 9
Proposed mechanism by which myostatin (Mstn) induces reactive oxygen species (ROS) in skeletal muscle. Increased Mstn induces tumor necrosis factor‐α (TNF‐α) production via NF‐κB signaling, increasing the production of ROS by NADPH oxidase. The induced ROS results in a feed forward loop further increasing Mstn levels via NF‐κB signaling of TNF‐α. The increased ROS levels result in a decrease in muscle protein synthesis and an increase in protein degradation leading to skeletal muscle wasting. 5‐ASA and ascorbic acid block these pathways to reduce ROS, Mstn, and TNF‐α.
Similar articles
- Exercise training decreases NADPH oxidase activity and restores skeletal muscle mass in heart failure rats.
Cunha TF, Bechara LR, Bacurau AV, Jannig PR, Voltarelli VA, Dourado PM, Vasconcelos AR, Scavone C, Ferreira JC, Brum PC. Cunha TF, et al. J Appl Physiol (1985). 2017 Apr 1;122(4):817-827. doi: 10.1152/japplphysiol.00182.2016. Epub 2017 Jan 19. J Appl Physiol (1985). 2017. PMID: 28104751 - Interaction of Fibromodulin and Myostatin to Regulate Skeletal Muscle Aging: An Opposite Regulation in Muscle Aging, Diabetes, and Intracellular Lipid Accumulation.
Lee EJ, Ahmad SS, Lim JH, Ahmad K, Shaikh S, Lee YS, Park SJ, Jin JO, Lee YH, Choi I. Lee EJ, et al. Cells. 2021 Aug 13;10(8):2083. doi: 10.3390/cells10082083. Cells. 2021. PMID: 34440852 Free PMC article. - Myostatin is a novel tumoral factor that induces cancer cachexia.
Lokireddy S, Wijesoma IW, Bonala S, Wei M, Sze SK, McFarlane C, Kambadur R, Sharma M. Lokireddy S, et al. Biochem J. 2012 Aug 15;446(1):23-36. doi: 10.1042/BJ20112024. Biochem J. 2012. PMID: 22621320 Free PMC article. Retracted. - Sarcopenia in Chronic Kidney Disease: Factors, Mechanisms, and Therapeutic Interventions.
Watanabe H, Enoki Y, Maruyama T. Watanabe H, et al. Biol Pharm Bull. 2019;42(9):1437-1445. doi: 10.1248/bpb.b19-00513. Biol Pharm Bull. 2019. PMID: 31474705 Review. - The role of TGF-β signaling in muscle atrophy, sarcopenia and cancer cachexia.
Lan XQ, Deng CJ, Wang QQ, Zhao LM, Jiao BW, Xiang Y. Lan XQ, et al. Gen Comp Endocrinol. 2024 Jul 1;353:114513. doi: 10.1016/j.ygcen.2024.114513. Epub 2024 Apr 10. Gen Comp Endocrinol. 2024. PMID: 38604437 Review.
Cited by
- Apitherapy for Age-Related Skeletal Muscle Dysfunction (Sarcopenia): A Review on the Effects of Royal Jelly, Propolis, and Bee Pollen.
Ali AM, Kunugi H. Ali AM, et al. Foods. 2020 Sep 25;9(10):1362. doi: 10.3390/foods9101362. Foods. 2020. PMID: 32992744 Free PMC article. Review. - Impact of oxidative stress on exercising skeletal muscle.
Steinbacher P, Eckl P. Steinbacher P, et al. Biomolecules. 2015 Apr 10;5(2):356-77. doi: 10.3390/biom5020356. Biomolecules. 2015. PMID: 25866921 Free PMC article. Review. - Signals of Ezh2, Src, and Akt Involve in myostatin-Pax7 pathways regulating the myogenic fate determination during the sheep myoblast proliferation and differentiation.
Wei C, Ren H, Xu L, Li L, Liu R, Zhang L, Zhao F, Lu J, Zhang X, Du L. Wei C, et al. PLoS One. 2015 Mar 26;10(3):e0120956. doi: 10.1371/journal.pone.0120956. eCollection 2015. PLoS One. 2015. PMID: 25811841 Free PMC article. - Systems biology and network pharmacology of frailty reveal novel epigenetic targets and mechanisms.
Gomez-Verjan JC, Ramírez-Aldana R, Pérez-Zepeda MU, Quiroz-Baez R, Luna-López A, Gutierrez Robledo LM. Gomez-Verjan JC, et al. Sci Rep. 2019 Jul 22;9(1):10593. doi: 10.1038/s41598-019-47087-7. Sci Rep. 2019. PMID: 31332237 Free PMC article. - Influence of hypoxic stimulation on angiogenesis and satellite cells in mouse skeletal muscle.
Nagahisa H, Miyata H. Nagahisa H, et al. PLoS One. 2018 Nov 8;13(11):e0207040. doi: 10.1371/journal.pone.0207040. eCollection 2018. PLoS One. 2018. PMID: 30408093 Free PMC article.
References
- Aiken J, Bua E, Cao Z, Lopez M, Wanagat JON, McKenzie D, McKiernan S (2002) Mitochondrial DNA deletion mutations and sarcopenia. Ann. N Y Acad. Sci. 959, 412–423. - PubMed
- Baumann AP, Ibebunjo C, Grasser WA, Paralkar VM (2003) Myostatin expression in age and denervation‐induced skeletal muscle atrophy. J. Musculoskelet. Neuronal Interact. 3, 8–16. - PubMed
- Beers RF, Sizer IW (1952) A Spectrophotometric method for measuring the breakdown of hydrogen peroxide by catalase. J. Biol. Chem. 195, 133–140. - PubMed
- Bradford MM (1976) A rapid and sensitive method for the quantitation of microgram quantities of protein utilizing the principle of protein‐dye binding. Anal. Biochem. 72, 248–254. - PubMed
Publication types
MeSH terms
Substances
LinkOut - more resources
Full Text Sources
Other Literature Sources
Medical
Miscellaneous
