Physiology of consumption of human milk oligosaccharides by infant gut-associated bifidobacteria - PubMed (original) (raw)
Physiology of consumption of human milk oligosaccharides by infant gut-associated bifidobacteria
Sadaki Asakuma et al. J Biol Chem. 2011.
Abstract
The bifidogenic effect of human milk oligosaccharides (HMOs) has long been known, yet the precise mechanism underlying it remains unresolved. Recent studies show that some species/subspecies of Bifidobacterium are equipped with genetic and enzymatic sets dedicated to the utilization of HMOs, and consequently they can grow on HMOs; however, the ability to metabolize HMOs has not been directly linked to the actual metabolic behavior of the bacteria. In this report, we clarify the fate of each HMO during cultivation of infant gut-associated bifidobacteria. Bifidobacterium bifidum JCM1254, Bifidobacterium longum subsp. infantis JCM1222, Bifidobacterium longum subsp. longum JCM1217, and Bifidobacterium breve JCM1192 were selected for this purpose and were grown on HMO media containing a main neutral oligosaccharide fraction. The mono- and oligosaccharides in the spent media were labeled with 2-anthranilic acid, and their concentrations were determined at various incubation times using normal phase high performance liquid chromatography. The results reflect the metabolic abilities of the respective bifidobacteria. B. bifidum used secretory glycosidases to degrade HMOs, whereas B. longum subsp. infantis assimilated all HMOs by incorporating them in their intact forms. B. longum subsp. longum and B. breve consumed lacto-N-tetraose only. Interestingly, B. bifidum left degraded HMO metabolites outside of the cell even when the cells initiate vegetative growth, which indicates that the different species/subspecies can share the produced sugars. The predominance of type 1 chains in HMOs and the preferential use of type 1 HMO by infant gut-associated bifidobacteria suggest the coevolution of the bacteria with humans.
Figures
FIGURE 1.
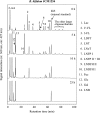
HPLC profiles of the HMOs consumption by B. bifidum JCM1254 cells at different times. The sugars were derivatized by 2-anthranilic acid, solid phase-purified, and analyzed as described under the “Experimental Procedures.” The peaks (1–14) were identified by comparing their retention times with those of the standard sugars.
FIGURE 2.
Growth of the bifidobacteria in the basal media containing HMOs as carbon sources. Open squares, B. longum subsp. infantis JCM1222; closed diamonds, B. bifidum JCM1254; open triangles, B. longum subsp. longum JCM1217; closed circles, B. breve JCM1192.
FIGURE 3.
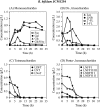
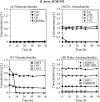
Changes in the concentrations of mono- and oligosaccharides in the culture of B. bifidum JCM1254 grown in HMO medium. The samples were taken at the indicated times and analyzed. A, monosaccharide concentrations: open squares, Fuc; closed circles, Gal; open triangles, Glc; closed diamonds, GlcNAc. B, di- and trisaccharide concentrations: open triangles, Lac; closed circles, LNB; open squares, 2′-FL; closed diamonds, 3-FL. C, tetrasaccharide concentrations: closed circles, LDFT; open triangles, LNT; open squares, LN_n_T. D, penta- and hexasaccharide concentrations: closed circles, LNFP I; open triangles, LNFP II + III; closed diamonds, LNDFH I; open squares, LNDFH II.
FIGURE 4.
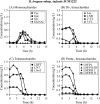
Changes in the concentrations of mono- and oligosaccharides in the culture of B. longum subsp. infantis JCM1222 grown in HMO medium. The samples were taken at the indicated times and analyzed. The symbols used are the same as described in the legend of Fig. 3.
FIGURE 5.
Changes in the concentrations of mono- and oligosaccharides in the culture of B. longum subsp. longum JCM1217 grown in HMO medium. The samples were taken at the indicated times and analyzed. The symbols used are the same as described in the legend of Fig. 3.
FIGURE 6.
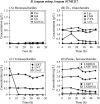
Changes in the concentrations of mono- and oligosaccharides in the culture of B. breve JCM1192 grown in HMO medium. The samples were taken at the indicated times and analyzed. The symbols used are the same as described in the legend of Fig. 3.
Similar articles
- Sharing of human milk oligosaccharides degradants within bifidobacterial communities in faecal cultures supplemented with Bifidobacterium bifidum.
Gotoh A, Katoh T, Sakanaka M, Ling Y, Yamada C, Asakuma S, Urashima T, Tomabechi Y, Katayama-Ikegami A, Kurihara S, Yamamoto K, Harata G, He F, Hirose J, Kitaoka M, Okuda S, Katayama T. Gotoh A, et al. Sci Rep. 2018 Sep 18;8(1):13958. doi: 10.1038/s41598-018-32080-3. Sci Rep. 2018. PMID: 30228375 Free PMC article. - Variation in consumption of human milk oligosaccharides by infant gut-associated strains of Bifidobacterium breve.
Ruiz-Moyano S, Totten SM, Garrido DA, Smilowitz JT, German JB, Lebrilla CB, Mills DA. Ruiz-Moyano S, et al. Appl Environ Microbiol. 2013 Oct;79(19):6040-9. doi: 10.1128/AEM.01843-13. Epub 2013 Jul 26. Appl Environ Microbiol. 2013. PMID: 23892749 Free PMC article. - Human Milk Oligosaccharide Utilization in Intestinal Bifidobacteria Is Governed by Global Transcriptional Regulator NagR.
Arzamasov AA, Nakajima A, Sakanaka M, Ojima MN, Katayama T, Rodionov DA, Osterman AL. Arzamasov AA, et al. mSystems. 2022 Oct 26;7(5):e0034322. doi: 10.1128/msystems.00343-22. Epub 2022 Sep 12. mSystems. 2022. PMID: 36094076 Free PMC article. - Nursing our microbiota: molecular linkages between bifidobacteria and milk oligosaccharides.
Sela DA, Mills DA. Sela DA, et al. Trends Microbiol. 2010 Jul;18(7):298-307. doi: 10.1016/j.tim.2010.03.008. Epub 2010 Apr 19. Trends Microbiol. 2010. PMID: 20409714 Free PMC article. Review. - Varied Pathways of Infant Gut-Associated Bifidobacterium to Assimilate Human Milk Oligosaccharides: Prevalence of the Gene Set and Its Correlation with Bifidobacteria-Rich Microbiota Formation.
Sakanaka M, Gotoh A, Yoshida K, Odamaki T, Koguchi H, Xiao JZ, Kitaoka M, Katayama T. Sakanaka M, et al. Nutrients. 2019 Dec 26;12(1):71. doi: 10.3390/nu12010071. Nutrients. 2019. PMID: 31888048 Free PMC article. Review.
Cited by
- Role of Human Milk Bioactives on Infants' Gut and Immune Health.
Carr LE, Virmani MD, Rosa F, Munblit D, Matazel KS, Elolimy AA, Yeruva L. Carr LE, et al. Front Immunol. 2021 Feb 12;12:604080. doi: 10.3389/fimmu.2021.604080. eCollection 2021. Front Immunol. 2021. PMID: 33643310 Free PMC article. Review. - Variation in the Conservation of Species-Specific Gene Sets for HMO Degradation and Its Effects on HMO Utilization in Bifidobacteria.
Hermes GDA, Rasmussen C, Wellejus A. Hermes GDA, et al. Nutrients. 2024 Jun 15;16(12):1893. doi: 10.3390/nu16121893. Nutrients. 2024. PMID: 38931248 Free PMC article. - Influence of microbially fermented 2´-fucosyllactose on neuronal-like cell activity in an in vitro co-culture system.
Kuntz S, Kunz C, Borsch C, Hill D, Morrin S, Buck R, Rudloff S. Kuntz S, et al. Front Nutr. 2024 Feb 8;11:1351433. doi: 10.3389/fnut.2024.1351433. eCollection 2024. Front Nutr. 2024. PMID: 38389793 Free PMC article. - Linking human milk oligosaccharide metabolism and early life gut microbiota: bifidobacteria and beyond.
Lordan C, Roche AK, Delsing D, Nauta A, Groeneveld A, MacSharry J, Cotter PD, van Sinderen D. Lordan C, et al. Microbiol Mol Biol Rev. 2024 Mar 27;88(1):e0009423. doi: 10.1128/mmbr.00094-23. Epub 2024 Jan 11. Microbiol Mol Biol Rev. 2024. PMID: 38206006 Free PMC article. Review. - Immunomodulatory and Prebiotic Effects of 2'-Fucosyllactose in Suckling Rats.
Azagra-Boronat I, Massot-Cladera M, Mayneris-Perxachs J, Knipping K, Van't Land B, Tims S, Stahl B, Garssen J, Franch À, Castell M, Rodríguez-Lagunas MJ, Pérez-Cano FJ. Azagra-Boronat I, et al. Front Immunol. 2019 Jul 31;10:1773. doi: 10.3389/fimmu.2019.01773. eCollection 2019. Front Immunol. 2019. PMID: 31417553 Free PMC article.
References
- Newburg D. S., Neubauer S. H. (1995) in Handbook of Milk Composition (Jensen R G. ed) pp. 273–349, Academic Press, San Diego
- Ninonuevo M. R., Park Y., Yin H., Zhang J., Ward R. E., Clowers B. H., German J. B., Freeman S. L., Killeen K., Grimm R., Lebrilla C. B. (2006) J. Agric. Food Chem. 54, 7471–7480 - PubMed
- Urashima T., Kitaoka M., Terabayashi T., Fukuda K., Ohnishi M., Kobata A. (2011) in Oligosaccharides: Sources, Properties, and Applications (Gordon N. G. ed) pp. 1–58, Nova Science Publishers, New York
- Amano J., Osanai M., Orita T., Sugahara D., Osumi K. (2009) Glycobiology 19, 601–614 - PubMed
Publication types
MeSH terms
Substances
LinkOut - more resources
Full Text Sources
Other Literature Sources
Research Materials
