Decreased miR-29 suppresses myogenesis in CKD - PubMed (original) (raw)
Decreased miR-29 suppresses myogenesis in CKD
Xiaonan H Wang et al. J Am Soc Nephrol. 2011 Nov.
Abstract
The mechanisms underlying the muscle wasting that accompanies CKD are not well understood. Animal models suggest that impaired differentiation of muscle progenitor cells may contribute. Expression of the myogenesis-suppressing transcription factor Ying Yang-1 increases in muscle of animals with CKD, but the mechanism underlying this increased expression is unknown. Here, we examined a profile of microRNAs in muscles from mice with CKD and observed downregulation of both microRNA-29a (miR-29a) and miR-29b. Because miR-29 has a complementary sequence to the 3'-untranslated region of Ying Yang-1 mRNA, a decrease in miR-29 could increase Ying Yang-1. We used adenovirus-mediated gene transfer to express miR-29 in C2C12 myoblasts and measured its effect on both Ying Yang-1 and myoblast differentiation. An increase in miR-29 decreased the abundance of Ying Yang-1 and improved the differentiation of myoblasts into myotubes. Similarly, using myoblasts isolated from muscles of mice with CKD, an increase in miR-29 improved differentiation of muscle progenitor cells into myotubes. In conclusion, CKD suppresses miR-29 in muscle, which leads to higher expression of the transcription factor Ying Yang-1, thereby suppressing myogenesis. These data suggest a potential mechanism for the impaired muscle cell differentiation associated with CKD.
Figures
Figure 1.
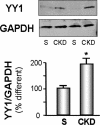
YY1 is increased in CKD muscle. The level of YY1 protein in gastrocnemius muscles of CKD and sham-operated, pair-fed, control mice (S) was measured by Western blot; glyceraldehyde-3-phosphate dehydrogenase (GAPDH) was the loading control. The bar graphs (mean ± SEM) represent the density of YY1 bands expressed as a percentage of control levels after correcting for GAPDH (n = 4 pairs; *P < 0.05 versus control [S]).
Figure 2.
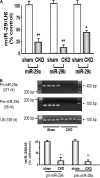
MiR-29 is decreased in muscles of CKD. (A) miR-29 in MPCs isolated from hind-limb muscles of CKD or control (sham) mice were measured by real-time qPCR. The bar graph shows miR-29a, miR-29b, and miR-29c from CKD mice expressed as a percentage of levels in MPCs of control mice; results are normalized to U6 RNA as an internal control (n = 4 pairs; *P < 0.05 or **P < 0.01 versus sham). (B) RT-PCR was used to detect the pri-miR-29a and pre-miR-29a in MPCs isolated from hind-limb muscles of CKD or control (sham) mice. The bar graph shows the density of pri-miR-29a or pre-miR-29a bands expressed as a percentage change from control levels after normalization to the density of U6 RNA (n = 6 pairs; *P < 0.05 or **P < 0.01 versus sham).
Figure 3.
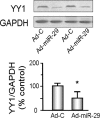
miR-29 decreases YY1 protein abundance in C2C12 cells. C2C12 cells were transduced with either Ad-miR-29 or control adenovirus (Ad-C) and their differentiations were assessed by changing the growth media to differentiation media. Proteins isolated from each group of cells were used to measure YY1 protein by Western blotting; glyceraldehyde-3-phosphate dehydrogenase (GAPDH) was the loading control. The bar graph shows the density of YY1 protein expressed as a percent of control value after being normalized to GAPDH (n = 6; *P < 0.05 versus Ad-C).
Figure 4.
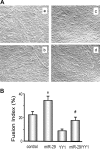
miR-29 in C2C12 muscle cells protects against YY1-induced suppression of their differentiation. (A) C2C12 myoblasts were expressed by (a) Ad-ctrl; (b) miR-29 (Ad-miR-29); (c) YY1 (pCMV-YY1); or (d) miR29 + YY1 (Ad-miR-29 and pCMV-YY1). After culturing in differentiation media, cell morphology was visualized using an Olympus 1 × 51 inverted microscope. Nuclei were stained with 4-diamidino-2-phenylindole. (B) The fusion index was calculated as the ratio of the number of nuclei within myotubes to the total number of nuclei in predefined fields of >450 nuclei. The experiment was repeated an additional three times, yielding the same conclusion (n = 4; *P < 0.05 versus control; #P < 0.05 versus YY1 treatment).
Figure 5.
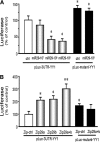
miR-29 binds to the 3′-UTR of YY1, suppressing YY1 luciferase activation in C2C12 muscle cells. (A) C2C12 myoblasts were transfected with pLuc-3URT-YY1 and treated with control virus or 107, 108, or 109 TU of Ad-miR-29. The control virus (ctrl) is represented by the white bar and expressed as 100%. The gray bars indicate that progressively higher levels of miR-29 interact with the 3′-UTR of YY1 to suppress luciferase activity. The black bars were cells transfected with pLuc-3URTmutant-YY1 (pLuc-mutant-YY1, lacking the miR-29 recognition sequence) in cells without (left) or with (right) exogenously added miR-29. Triplicate determinations were made for cells in each condition, and each experiment was repeated two additional times; the results were combined to calculate luciferase activity. The data represent the means ± SEM; n = 9; *P < 0.05 versus pLuc-3URT-YY1 plus ctrl (white bar). (B) To block miR-29 expression, vectors that express an antisense of miR-29a or miR-29b (pmiRZip29a or/and pmiRZip29b) were transfected into myoblasts with pLuc-3UTR-YY1. The control vector (zip-ctrl) is represented by the white bar and expressed as 100%. The black control bars were cells transfected with pLuc-3URTmutant-YY1 with pmiRZip-ctrl (left) or pmiRZip29a+b (right). The experiment was repeated three times with triplicate determinations for each plasmid. The data represent the means ± SEM; n = 9, *P < 0.05 or **P < 0.01 versus pLuc-3URT-YY1 plus zip-ctrl (white bar).
Figure 6.
miR-29 protects against CKD-induced suppression of MPCs differentiation. MPCs isolated from hind-limb muscles of CKD or sham-operated, pair-fed mice (sham) were cultured in differentiation media on Entactin, Collagen IV, and Laminin matrix coated plates. Immunohistochemistry with an antibody against eMyHC was used to assess MPCs differentiation into myotubes. Nuclei (blue) were stained with 4-diamidino-2-phenylindole, and red identifies eMyHC.
Figure 7.
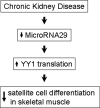
Decreased miR-29 causes increased YY1 to suppress satellite cell differentiation in mice with CKD.
Similar articles
- A Novel YY1-miR-1 regulatory circuit in skeletal myogenesis revealed by genome-wide prediction of YY1-miRNA network.
Lu L, Zhou L, Chen EZ, Sun K, Jiang P, Wang L, Su X, Sun H, Wang H. Lu L, et al. PLoS One. 2012;7(2):e27596. doi: 10.1371/journal.pone.0027596. Epub 2012 Feb 1. PLoS One. 2012. PMID: 22319554 Free PMC article. - A novel target of microRNA-29, Ring1 and YY1-binding protein (Rybp), negatively regulates skeletal myogenesis.
Zhou L, Wang L, Lu L, Jiang P, Sun H, Wang H. Zhou L, et al. J Biol Chem. 2012 Jul 20;287(30):25255-65. doi: 10.1074/jbc.M112.357053. Epub 2012 May 31. J Biol Chem. 2012. PMID: 22661705 Free PMC article. - Role of MiR-325-3p in the Regulation of CFL2 and Myogenic Differentiation of C2C12 Myoblasts.
Nguyen MT, Lee W. Nguyen MT, et al. Cells. 2021 Oct 12;10(10):2725. doi: 10.3390/cells10102725. Cells. 2021. PMID: 34685705 Free PMC article. - NF-kappaB-YY1-miR-29 regulatory circuitry in skeletal myogenesis and rhabdomyosarcoma.
Wang H, Garzon R, Sun H, Ladner KJ, Singh R, Dahlman J, Cheng A, Hall BM, Qualman SJ, Chandler DS, Croce CM, Guttridge DC. Wang H, et al. Cancer Cell. 2008 Nov 4;14(5):369-81. doi: 10.1016/j.ccr.2008.10.006. Cancer Cell. 2008. PMID: 18977326 Free PMC article. - The role of microRNAs in skeletal muscle health and disease.
Kirby TJ, Chaillou T, McCarthy JJ. Kirby TJ, et al. Front Biosci (Landmark Ed). 2015 Jan 1;20(1):37-77. doi: 10.2741/4298. Front Biosci (Landmark Ed). 2015. PMID: 25553440 Free PMC article. Review.
Cited by
- Myostatin suppression of Akirin1 mediates glucocorticoid-induced satellite cell dysfunction.
Dong Y, Pan JS, Zhang L. Dong Y, et al. PLoS One. 2013;8(3):e58554. doi: 10.1371/journal.pone.0058554. Epub 2013 Mar 13. PLoS One. 2013. PMID: 23516508 Free PMC article. - Loss of miR-29b following acute ischemic stroke contributes to neural cell death and infarct size.
Khanna S, Rink C, Ghoorkhanian R, Gnyawali S, Heigel M, Wijesinghe DS, Chalfant CE, Chan YC, Banerjee J, Huang Y, Roy S, Sen CK. Khanna S, et al. J Cereb Blood Flow Metab. 2013 Aug;33(8):1197-206. doi: 10.1038/jcbfm.2013.68. Epub 2013 May 1. J Cereb Blood Flow Metab. 2013. PMID: 23632968 Free PMC article. - Muscle wasting from kidney failure-a model for catabolic conditions.
Wang XH, Mitch WE. Wang XH, et al. Int J Biochem Cell Biol. 2013 Oct;45(10):2230-8. doi: 10.1016/j.biocel.2013.06.027. Epub 2013 Jul 16. Int J Biochem Cell Biol. 2013. PMID: 23872437 Free PMC article. Review. - Mechanisms of IGF-1-Mediated Regulation of Skeletal Muscle Hypertrophy and Atrophy.
Yoshida T, Delafontaine P. Yoshida T, et al. Cells. 2020 Aug 26;9(9):1970. doi: 10.3390/cells9091970. Cells. 2020. PMID: 32858949 Free PMC article. Review. - Integrative Analysis of MicroRNA and mRNA Data Reveals an Orchestrated Function of MicroRNAs in Skeletal Myocyte Differentiation in Response to TNF-α or IGF1.
Meyer SU, Sass S, Mueller NS, Krebs S, Bauersachs S, Kaiser S, Blum H, Thirion C, Krause S, Theis FJ, Pfaffl MW. Meyer SU, et al. PLoS One. 2015 Aug 13;10(8):e0135284. doi: 10.1371/journal.pone.0135284. eCollection 2015. PLoS One. 2015. PMID: 26270642 Free PMC article.
References
- Carrero JJ, Chmielewski M, Axelsson J, Snaedal S, Heimburger O, Barany P, Suliman ME, Lindholm B, Stenvinkel P, Qureshi AR: Muscle atrophy, inflammation and clinical outcome in incident and prevalent dialysis patients. Clin Nutr 27: 557–564, 2008 - PubMed
Publication types
MeSH terms
Substances
Grants and funding
- P30 AI050409/AI/NIAID NIH HHS/United States
- DK062081/DK/NIDDK NIH HHS/United States
- R01 AR060268/AR/NIAMS NIH HHS/United States
- R37 DK37175/DK/NIDDK NIH HHS/United States
- R01 DK062081/DK/NIDDK NIH HHS/United States
- R37 DK037175/DK/NIDDK NIH HHS/United States
LinkOut - more resources
Full Text Sources
Other Literature Sources
Medical
