Mechanisms establishing TLR4-responsive activation states of inflammatory response genes - PubMed (original) (raw)
. 2011 Dec;7(12):e1002401.
doi: 10.1371/journal.pgen.1002401. Epub 2011 Dec 8.
Christopher Benner, Minna U Kaikkonen, Jean Lozach, Sven Heinz, Nathan J Spann, Andrea Crotti, Josh Stender, Serena Ghisletti, Donna Reichart, Christine S Cheng, Rosa Luna, Colleen Ludka, Roman Sasik, Ivan Garcia-Bassets, Alexander Hoffmann, Shankar Subramaniam, Gary Hardiman, Michael G Rosenfeld, Christopher K Glass
Affiliations
- PMID: 22174696
- PMCID: PMC3234212
- DOI: 10.1371/journal.pgen.1002401
Mechanisms establishing TLR4-responsive activation states of inflammatory response genes
Laure Escoubet-Lozach et al. PLoS Genet. 2011 Dec.
Abstract
Precise control of the innate immune response is required for resistance to microbial infections and maintenance of normal tissue homeostasis. Because this response involves coordinate regulation of hundreds of genes, it provides a powerful biological system to elucidate the molecular strategies that underlie signal- and time-dependent transitions of gene expression. Comprehensive genome-wide analysis of the epigenetic and transcription status of the TLR4-induced transcriptional program in macrophages suggests that Toll-like receptor 4 (TLR4)-dependent activation of nearly all immediate/early- (I/E) and late-response genes results from a sequential process in which signal-independent factors initially establish basal levels of gene expression that are then amplified by signal-dependent transcription factors. Promoters of I/E genes are distinguished from those of late genes by encoding a distinct set of signal-dependent transcription factor elements, including TATA boxes, which lead to preferential binding of TBP and basal enrichment for RNA polymerase II immediately downstream of transcriptional start sites. Global nuclear run-on (GRO) sequencing and total RNA sequencing further indicates that TLR4 signaling markedly increases the overall rates of both transcriptional initiation and the efficiency of transcriptional elongation of nearly all I/E genes, while RNA splicing is largely unaffected. Collectively, these findings reveal broadly utilized mechanisms underlying temporally distinct patterns of TLR4-dependent gene activation required for homeostasis and effective immune responses.
Conflict of interest statement
The authors have declared that no competing interests exist.
Figures
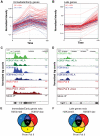
Figure 1. Immediate/early (I/E) and late genes exhibit characteristics of actively transcribed genes under basal conditions.
A, B. Classification of I/E and late genes based on gene expression profiling of elicited peritoneal macrophages treated with the TLR4-specific agonist Kdo2 lipid A (KLA) for 0, 1 or 12 h. Values represent normalized, relative expression levels. Lines color-coded blue are represent genes exhibiting promoter GC content >63%. Lines color-coded red represent genes exhibiting promoter GC content <63%. C., D. Genome browser images of normalized tag densities for H3K4me3, H3K9/14ac and total Pol II at the Tnf (C) and Isg20 (D) loci. E, F. Relationship of basal H3K4me3, H3K9/14ac and total Pol II at I/E (E) and late (F) promoters.
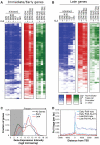
Figure 2. Relationships of histone modifications and RNA polymerase II at I/E and late TLR4-responsive promoters.
A, B. Heat maps of normalized tag densities for the indicated histone marks, total RNA polymerase II (Pol II), or GRO-Seq. Values for murine embryonic fibroblasts (MEFs), murine embryonic fibroblasts (ES), and neuronal progenitor cells (NPCs) are based on data reported in . All other lanes represent values from elicited peritoneal macrophages treated with KLA or control solvent for 1 h. C. Distribution of gene expression values as measured by DNA microarray for I/E and late TLR-responsive genes under basal conditions. Values to the right of the gray box are considered to be confidently above signal background. Similar results are found when using RNA-Seq to quantify expression levels (Figure S2C). D. Distribution of RNA polymerase II at I/E and late genes.
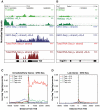
Figure 3. Analysis of nascent RNA transcripts (GRO-Seq), total RNA, and H4 acetylation.
A., B. Genome browser images of normalized tag densities for H4K8ac and strand specific GRO-Seq, and total RNA-Seq at the Tnf (A) and Isg20 (B) loci. C, D. Strand-specific distribution of GRO-Seq tag densities at I/E and late genes with KLA or control solvent for 1 h.
Figure 4. Quantification of elongation, splicing, and H4 actylation at I/E and late TLR4-responsive promoters.
A. Gene-specific comparison of the elongation efficiency between control and KLA at 1 h treated samples for I/E genes. Elongation efficiency was defined as the ratio of strand-specific GRO-Seq tag density found within the gene body (+500 to +2500 bp downstream of the TSS) to the GRO-Seq tag density found at the proximal promoter (−25 bp to +175 bp). B. Gene-specific comparison of splicing efficiency between control and KLA treated total RNA-Seq samples at 1 h for I/E genes. Splicing efficiency was defined as one minus the ratio of intron RNA-Seq tag density divided by the exon RNA-Seq tag density for each gene. Only genes with intron and exon tag densities exceeding 1 read per kb were used included in this analysis. C. Visualization of tag-densities mapping across 5′ splice junctions in I/E genes. The density of the 3′ ends of total RNA-Seq tags (32 bp in length) are plotted relative to all RefSeq defined 5′ splice junctions in I/E genes. Splicing efficiency was estimated as one minus the ratio of the density of tags confidently mapping across the splice junction (3′ end from from +7 bp to +25 bp) by the density found in the exons (3′ end from −25 bp to −7 bp). D, E. Distribution of H4ac (composed of H4K5ac/H4K8ac/H4K12ac) and p300 at I/E and late genes.
Figure 5. Differential use of signal-dependent transcription factors and TBP in I/E and late promoters.
A. Sequence motifs identified by de novo motif analysis of the promoters of I/E and late genes. B. Scatter plots of normalized ChIP-Seq tag densities for Pol II and TBP in the interval from −100 to +250 bp from the TSS. C, D. Cumulative position-specific ChIP-Seq tag densities for H3K4me3, H3K9/14ac, Pol II and TBP determined under basal conditions for I/E (C) and late (D) genes.
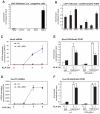
Figure 6. The H3K4me3 mark can be established independently of signal-dependent activators.
A. The H3K4me3 mark is absent from the Ptgs2, Cxcl10, IL1b and Nos2 promoters in Lin- hematopoietic progenitor cells. B. The H3K4me3 mark is present on the Ptgs2, Cxcl10, IL1b and Nos2 promoters in PUER myeloid progenitor cells. C, D., KLA induction of Nos2 and Cxcl10 in MEFs requires p65 and IRF3. WT or p65/IRF3 DKO MEFs were treated for the indicated times with KLA and Nos2 (C) and Cxcl10 (F) mRNA levels were determined by Q-PCR. E, F., Q-PCR analysis of H3K4me3 at the Nos2 and Cxcl10 promoters under basal and KLA-treated conditions in WT and p65/IRF3 DKO MEFS.
Figure 7. PU.1 establishes promoter H3K4me3 and basal expression required for KLA activation of a subset of TLR4-responsive genes.
ChIP-Seq and GRO-Seq experiments were performed in PU.1-null hematopoietic progenitor cells (PU.1 KO) and in PUER cells treated with tamoxifen for the indicated times. Genome browser images are shown for Slc5a3 (A) and Slc7a11 (B). Tracks from top to bottom are H3K4me3 tags in PU.1 KO cells, H3K4me3 tags in PUER cells cultured for 24 h with tamoxifen, H3K4me3 tags in PUER cells cultured for 48 h with tamoxifen, PUER (PU.1 binding activity) tags in PUER cells cultured for 24 h with tamoxifen, C/EBPβ tags in PU.1 KO cells, C/EBPβ tags in PUER cells cultured for 24 h with tamoxifen, mRNA-strand specific GRO-Seq tags in untreated PU.1 KO cells, mRNA-strand specific GRO-Seq tags in PU.1 KO cells treated with KLA for 1 h, mRNA-strand specific GRO-Seq tags in PUER cells cultured in tamoxifen for 24 h, and mRNA-strand specific GRO-Seq tags in PUER cells cultured in tamoxifen for 24 h and treated with KLA for 1 h. ChIP-Seq data for PU.1 and C/EBPβ is from .
Similar articles
- Transcriptome sequencing of microglial cells stimulated with TLR3 and TLR4 ligands.
Das A, Chai JC, Kim SH, Lee YS, Park KS, Jung KH, Chai YG. Das A, et al. BMC Genomics. 2015 Jul 10;16(1):517. doi: 10.1186/s12864-015-1728-5. BMC Genomics. 2015. PMID: 26159724 Free PMC article. - Control of proinflammatory gene programs by regulated trimethylation and demethylation of histone H4K20.
Stender JD, Pascual G, Liu W, Kaikkonen MU, Do K, Spann NJ, Boutros M, Perrimon N, Rosenfeld MG, Glass CK. Stender JD, et al. Mol Cell. 2012 Oct 12;48(1):28-38. doi: 10.1016/j.molcel.2012.07.020. Epub 2012 Aug 23. Mol Cell. 2012. PMID: 22921934 Free PMC article. - Signal Integration of IFN-I and IFN-II With TLR4 Involves Sequential Recruitment of STAT1-Complexes and NFκB to Enhance Pro-inflammatory Transcription.
Piaszyk-Borychowska A, Széles L, Csermely A, Chiang HC, Wesoły J, Lee CK, Nagy L, Bluyssen HAR. Piaszyk-Borychowska A, et al. Front Immunol. 2019 Jun 4;10:1253. doi: 10.3389/fimmu.2019.01253. eCollection 2019. Front Immunol. 2019. PMID: 31231385 Free PMC article. - A new role for myeloid HO-1 in the innate to adaptive crosstalk and immune homeostasis.
Koliaraki V, Kollias G. Koliaraki V, et al. Adv Exp Med Biol. 2011;780:101-11. doi: 10.1007/978-1-4419-5632-3_9. Adv Exp Med Biol. 2011. PMID: 21842368 Review. - Epigenetic Mechanisms Governing Innate Inflammatory Responses.
Perkins DJ, Patel MC, Blanco JC, Vogel SN. Perkins DJ, et al. J Interferon Cytokine Res. 2016 Jul;36(7):454-61. doi: 10.1089/jir.2016.0003. J Interferon Cytokine Res. 2016. PMID: 27379867 Free PMC article. Review.
Cited by
- Physical fitness status modulates the inflammatory proteins in peripheral blood and circulating monocytes: role of PPAR-gamma.
Antunes BM, Rosa-Neto JC, Batatinha HAP, Franchini E, Teixeira AM, Lira FS. Antunes BM, et al. Sci Rep. 2020 Aug 24;10(1):14094. doi: 10.1038/s41598-020-70731-6. Sci Rep. 2020. PMID: 32839476 Free PMC article. - BTB-ZF transcriptional regulator PLZF modifies chromatin to restrain inflammatory signaling programs.
Sadler AJ, Rossello FJ, Yu L, Deane JA, Yuan X, Wang D, Irving AT, Kaparakis-Liaskos M, Gantier MP, Ying H, Yim HC, Hartland EL, Notini AJ, de Boer S, White SJ, Mansell A, Liu JP, Watkins DN, Gerondakis S, Williams BR, Xu D. Sadler AJ, et al. Proc Natl Acad Sci U S A. 2015 Feb 3;112(5):1535-40. doi: 10.1073/pnas.1409728112. Epub 2015 Jan 20. Proc Natl Acad Sci U S A. 2015. PMID: 25605927 Free PMC article. - The Importance of Controlling Transcription Elongation at Coding and Noncoding RNA Loci.
Scruggs BS, Adelman K. Scruggs BS, et al. Cold Spring Harb Symp Quant Biol. 2015;80:33-44. doi: 10.1101/sqb.2015.80.027235. Cold Spring Harb Symp Quant Biol. 2015. PMID: 27325707 Free PMC article. Review. - A novel mechanism of regulation of the oncogenic transcription factor GLI3 by toll-like receptor signaling.
Matissek SJ, Karbalivand M, Han W, Boutilier A, Yzar-Garcia E, Kehoe LL, Gardner DS, Hage A, Fleck K, Jeffers V, Rajsbaum R, Elsawa SF. Matissek SJ, et al. Oncotarget. 2022 Aug 3;13:944-959. doi: 10.18632/oncotarget.28261. eCollection 2022. Oncotarget. 2022. PMID: 35937499 Free PMC article. - Negative elongation factor complex enables macrophage inflammatory responses by controlling anti-inflammatory gene expression.
Yu L, Zhang B, Deochand D, Sacta MA, Coppo M, Shang Y, Guo Z, Zeng X, Rollins DA, Tharmalingam B, Li R, Chinenov Y, Rogatsky I, Hu X. Yu L, et al. Nat Commun. 2020 May 8;11(1):2286. doi: 10.1038/s41467-020-16209-5. Nat Commun. 2020. PMID: 32385332 Free PMC article.
References
- Janeway CA, Jr, Medzhitov R. Innate immune recognition. Annu Rev Immunol. 2002;20:197–216. - PubMed
- Doyle SL, O'Neill LA. Toll-like receptors: From the discovery of NFkappaB to new insights into transcriptional regulations in innate immunity. Biochem Pharmacol 2006 - PubMed
- Takeuchi O, Akira S. Pattern recognition receptors and inflammation. Cell. 2010;140:805–820. - PubMed
- Poltorak A, He X, Smirnova I, Liu MY, Van Huffel C, et al. Defective LPS signaling in C3H/HeJ and C57BL/10ScCr mice: mutations in Tlr4 gene. Science. 1998;282:2085–2088. - PubMed
- Noppert SJ, Fitzgerald KA, Hertzog PJ. The role of type I interferons in TLR responses. Immunol Cell Biol. 2007;85:446–457. - PubMed
Publication types
MeSH terms
Substances
Grants and funding
- HC088093/HC/NHLBI NIH HHS/United States
- HHMI/Howard Hughes Medical Institute/United States
- R01 HL065445/HL/NHLBI NIH HHS/United States
- R01 CA052599/CA/NCI NIH HHS/United States
- P30 DK063491/DK/NIDDK NIH HHS/United States
- CA52599/CA/NCI NIH HHS/United States
- DK063491/DK/NIDDK NIH HHS/United States
LinkOut - more resources
Full Text Sources
Other Literature Sources
Molecular Biology Databases


