Regulation of mitochondrial transport and inter-microtubule spacing by tau phosphorylation at the sites hyperphosphorylated in Alzheimer's disease - PubMed (original) (raw)
Comparative Study
Regulation of mitochondrial transport and inter-microtubule spacing by tau phosphorylation at the sites hyperphosphorylated in Alzheimer's disease
Kourosh Shahpasand et al. J Neurosci. 2012.
Abstract
The microtubule-associated protein Tau is a major component of the neurofibrillary tangles that serve as a neuropathological hallmark of Alzheimer's disease. Tau is a substrate for protein phosphorylation at multiple sites and occurs in tangles in a hyperphosphorylated state. However, the physiological functions of Tau phosphorylation or how it may contribute mechanistically to Alzheimer's pathophysiology are not completely understood. Here, we examined the function of human Tau phosphorylation at three sites, Ser199, Ser202, and Thr205, which together comprise the AT8 sites that mark abnormal phosphorylation in Alzheimer's disease. Overexpression of wild-type Tau or mutated forms in which these sites had been changed to either unphosphorylatable alanines or phosphomimetic aspartates inhibited mitochondrial movement in the neurite processes of PC12 cells as well as the axons of mouse brain cortical neurons. However, the greatest effects on mitochondrial translocation were induced by phosphomimetic mutations. These mutations also caused expansion of the space between microtubules in cultured cells when membrane tension was reduced by disrupting actin filaments. Thus, Tau phosphorylation at the AT8 sites may have meaningful effects on mitochondrial movement, likely by controlling microtubule spacing. Hyperphosphorylation of the AT8 sites may contribute to axonal degeneration by disrupting mitochondrial transport in Alzheimer's disease.
Figures
Figure 1.
Phospho-mimic mutant of Tau 3D at the AT8 sites Ser199/Ser202/Thr205. A, Schematic representation of the longest human isoform of Tau composed of 441 amino acid residues. Tau consists of the N-terminal projection domain and C-terminal MT-assembly domain including four MT-binding repeats (R1–R4). Two proline-rich regions (P1 and P2) are present in the middle region. The AT8 Ser199/Ser202/Thr205 sites are located in the N-terminal side of P2 at the border of the projection domain and MT-binding domain. This molecular structure was drawn based on the description by Jeganathan et al. (2006). Amino acids that can be phosphorylated were replaced with Asp or Ala to generate the phosphorylation mimic (3D) or nonphosphorylated (3A) Tau constructs, respectively. B, Cdk5-dependent in vitro phosphorylation at the AT8 sites of Tau WT, but not Tau 3A or 3D. Tau WT, 3A, and 3D were phosphorylated in vitro with Cdk5–p25. Immunoblots were performed with anti-human Tau (h-Tau) or AT8. C, Phosphorylation at the AT8 sites of Tau WT, but not 3A or 3D, in COS-7 cells. Tau WT, 3A, or 3D was expressed in COS-7 cells. Cell lysates were subjected to immunoblotting for h-Tau or AT8. The bottom panel shows evaluation of phosphorylation state-dependent mobility shifts of Tau WT, 3A, or 3D expressed in COS-7 cells by Phos-tag SDS-PAGE. Tau WT, 3A, and 3D separated by Phos-tag SDS-PAGE were immunoblotted with anti-human Tau. Cont, Control. D, Alignment of Tau 3A and 3D to compare their banding patterns in Phos-tag SDS-PAGE. Phos-tag immunoblots of Tau 3A and 3D in C were aligned by adjusting the fastest moving band. E, Tau 3D takes conformation similar to phosphorylated Tau WT. After in vitro phosphorylation of Tau constructs with Cdk5–p25, dot blots were performed with phosphorylation-independent antibody h-Tau (top) and with phosphorylation-dependent antibodies, MC-1 (middle), and Alz-50 (bottom).
Figure 2.
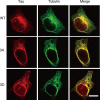
Colocalization of Tau WT, 3A, or 3D to MTs in COS-7 cells. Tau WT, 3A, or 3D vectors were used to transfect COS-7 cells. Soluble Tau and tubulin were removed by treatment with PEM containing 4
m
glycerol and 0.5% Triton X-100 for 10 min at 37°C, and cells were double-stained with anti-tubulin (green in middle panels) and anti-Tau (red in left panels), followed by fluorescently labeled secondary antibodies. Merged images are shown in the right panels. Scale bar, 20 μm.
Figure 3.
Quantification of levels of Tau overexpression in the PC12 cell neurites and in neuronal axons. A, Immunostaining of cortical neurons overexpressing Tau with anti-human Tau. Plasmids encoding Tau at concentrations of 2, 2.5, and 3 μ
m
were cotransfected with EGFP vector into cultured cortical neurons at DIV6, and these neurons were stained at DIV11. Transfected axons are indicated with arrowheads and un-transfected axons with arrows. Scale bar, 5 μm. B, C, Quantification of Tau expressed in PC12 cell neurites (B) and axon of cortical neurons (C). (n = 20 for each of PC12 cells and neurons, *p < 0.01, one-way ANOVA). Cont, Control.
Figure 4.
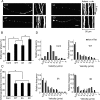
Effects of Tau WT, 3D, or 3A on mitochondrial movement in PC12 cells. A, Mitochondrial distribution and movements in neurite process of PC12 cells. PC12 cells were transfected with a Mito-GFP vector alone as a control (Cont) or cotransfected with a Mito-GFP and Tau WT, 3A, or 3D vector. PC12 cells were treated with NGF for 72 h after transfection. Mitochondrial distribution is shown by fluorescence of Mito-GFP (left panels). Right panels are kymographs of mitochondria moving in a process of a PC12 cell. Antero, Anterograde. Bar, 20 μm. B, The percentage ratio of pausing mitochondria in PC12 cell processes. Mitochondrial movement was recorded in the neurite-like processes at 5 s intervals over a 300 s period. Any mitochondrion that translocated at least 0.1 μm between two image frames was considered to be moving. The pausing time was expressed as the percentage of the total observation time (n = 35, *p < 0.01, one-way ANOVA). C, Effect of Tau WT, 3A, or 3D on anterograde or retrograde movement of mitochondria. The vertical axis indicates the ratio of anterogradely moving time to total moving duration. Statistical analysis was performed by ANCOVA as described in Materials and Methods. The ratio was significantly different between control and Tau-overexpressing PC12 cells (*p < 0.01), but was not significant between three Tau constructs (p = 0.75). D, Effect of Tau WT, 3D, or 3A on the velocity of mitochondria. Relative frequency of mitochondria moving at the indicated velocities in the anterograde (Ant, black) or retrograde (Ret, gray) direction for control, WT, 3A, or 3D. n = 35 mitochondria per sample.
Figure 5.
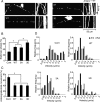
Reduced motile behavior of mitochondria in Tau-overexpressing neurons. A, Mitochondrial distribution and movements in axons of neurons. Cultured neurons at DIV6 were transfected with Mito-GFP vector alone (Cont, Control) or cotransfected with Mito-GFP and Tau WT, Tau 3A, or Tau 3D vector. Mitochondrial distribution is shown by fluorescence of Mito-GFP (left panels). Bar, 20 μm. Right panels are kymographs of mitochondria moving in axon of neurons. Antero, Anterograde. B, The percentage ratio of pausing mitochondria in axon of cultured neurons. The pausing duration was expressed as the percentage of total observation period (n = 35, *p < 0.01, one-way ANOVA,). C, The effect of Tau mutants on anterograde or retrograde movement of mitochondria. The vertical axis is the ratio of anterogradely moving duration to total moving period. The results were analyzed statistically by ANCOVA as described in Materials and Methods. The ratio was significantly different between control and Tau-overexpressing neurons (p < 0.01) but was not different between three Tau constructs (p = 0.55). D, Effect of Tau mutants on the velocity of mitochondria. Relative frequencies of mitochondria moving at the indicated velocities are shown in control neurons or in neurons expressing Tau WT, Tau 3A, or Tau 3D. Black represents anterograde (Ant) movement, and gray represents retrograde (Ret) movement (n = 35 mitochondria per sample).
Figure 6.
Tau does not inhibit the binding of kinesin to MTs. A, Coomassie staining of an SDS-PAGE gel to show the binding of kinesin to MTs independent of Tau-binding. MTs polymerized in the presence of 0.05, 0.1, or 0.15 μ
m
Tau WT, 3A, or 3D were incubated with 0.1 μ
m
kinesin head domain-His and, after separation of MTs by centrifugation, the MT pellet (p) and supernatant (s) were subjected to SDS-PAGE. The right side three lanes are tubulin (Tub), Tau WT (Tau), and kinesin (Kin) head domain-His, respectively, for references. B, An immunoblot confirming the binding of kinesin to MTs. MT pellet (p) and supernatant (s) shown in A are immunoblotted with anti-His antibody for detection of kinesin head domain-His.
Figure 7.
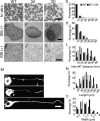
Inter-MT distance in MT bundles in the presence of Tau mutants. A–C, Electron micrographs of cross-sections of MT pellets polymerized in vitro with Tau WT (A), 3A (B), or 3D (C). Scale bar, 100 nm. D, The wall-to-wall distances between nearest-neighbor MTs were measured and expressed as the percentage of the total number of counted MTs. The mean distance was 11.7 ± 1.7 nm for Tau WT (n = 48), 11.8 ± 2.1 nm for Tau 3A (n = 51), and 11.9 ± 1.6 nm for Tau 3D (n = 69). E–G, Electron micrographs of processes of Sf9 cells [untreated (−)] expressing Tau WT (E), 3A (F), or 3D (G). H, Inter-MT distances were measured between nearest-neighbor MTs and expressed as the percentage of the total number of counts. The mean distance was 15.7 ± 2.2 nm for Tau WT (n = 30), 17.5 ± 2.7 nm for Tau 3A (n = 27), and 16.3 ± 2.2 nm for Tau 3D (n = 28). I–K, Electron micrographs of processes of latrunculin B-treated (+) Sf9 cells expressing Tau WT (I), 3A (J), or 3D (K). Sf9 cells were treated with 0.5 μg/ml latrunculin B for 72 h after infection with baculovirus expressing each Tau. L, Inter-MT distances were measured and expressed as the relative ratio of the total number of counts. The mean distance was 26.8 ± 2.7 nm for Tau WT (n = 60), 27.2 ± 2.0 nm for Tau 3A (n = 80), and 37.1 ± 2.3 nm for Tau 3D (n = 75). M, Immunostaining of Sf9 cells overexpressing Tau 3D (top), Tau 3A (middle), or WT (bottom) with anti-Tau. Scale bar, 20 μm. N, O, Sf9 cells overexpressing Tau 3D formed longer and wider processes compared to those expressing Tau WT or 3A. N, The length distribution of Sf9 cell processes overexpressing Tau constructs. The mean length was 106.5 ± 3.7 μm for Tau WT, 97.2 ± 5.3 μm for Tau 3A, and 119.1 ± 4.3 μm for Tau 3D (n = 20 for each Tau construct). O, The width distribution of Sf9 cell processes overexpressing Tau constructs. The mean width was 1.09 ± 0.04 μm for Tau WT, 1.04 ± 0.09 μm for Tau 3A, and 1.39 ± 0.07 μm for Tau 3D (n = 20 for each Tau construct).
Figure 8.
The distance between MTs in PC12 cell neurites overexpressing Tau constructs. A, Cross-sectional electron micrographs of PC12 cell neurites, control (Cont) or overexpressing Tau WT, 3A, or 3D. Scale bar, 100 nm. B, Inter-MT distances were measured between nearest-neighbor MTs and expressed as the percentage of the total number of counts. The mean distance was 45.1 ± 2.2 (n = 54) for control PC12 cells and 33.1 ± 2.4 nm (n = 49), 34.1 ± 2.6 nm (n = 44), and 34.19 ± 2.8 nm (n = 62) for PC12 cells overexpressing Tau WT, 3A, and 3D, respectively.
Figure 9.
Schematic representation of the greater impact of Tau phosphorylation on mitochondrial transport compared to nonphosphorylated Tau. A, Tau is a space-making protein attached to the MT surface. When Tau is not phosphorylated at Ser199/Ser202/Thr205, the N-terminal domain is folded. This conformation does not produce much resistance force against mitochondrial movement because MTs are in relatively close proximity. B, Tau phosphorylation at Ser199/Ser202/Thr205 may extend the projection domain away from the MT surface, increasing the repulsive forces between MTs. In this conformation, mitochondria encounter greater MT resistance to the slowing or arresting of their movement.
Similar articles
- Microtubule destruction induces tau liberation and its subsequent phosphorylation.
Miyasaka T, Sato S, Tatebayashi Y, Takashima A. Miyasaka T, et al. FEBS Lett. 2010 Jul 16;584(14):3227-32. doi: 10.1016/j.febslet.2010.06.014. Epub 2010 Jun 17. FEBS Lett. 2010. PMID: 20561519 - Alzheimer's disease hyperphosphorylated tau sequesters normal tau into tangles of filaments and disassembles microtubules.
Alonso AC, Grundke-Iqbal I, Iqbal K. Alonso AC, et al. Nat Med. 1996 Jul;2(7):783-7. doi: 10.1038/nm0796-783. Nat Med. 1996. PMID: 8673924 - Ubiquitination and abnormal phosphorylation of paired helical filaments in Alzheimer's disease.
Iqbal K, Grundke-Iqbal I. Iqbal K, et al. Mol Neurobiol. 1991;5(2-4):399-410. doi: 10.1007/BF02935561. Mol Neurobiol. 1991. PMID: 1726645 Review. - Early growth response 1 (Egr-1) regulates phosphorylation of microtubule-associated protein tau in mammalian brain.
Lu Y, Li T, Qureshi HY, Han D, Paudel HK. Lu Y, et al. J Biol Chem. 2011 Jun 10;286(23):20569-81. doi: 10.1074/jbc.M111.220962. Epub 2011 Apr 13. J Biol Chem. 2011. PMID: 21489990 Free PMC article. - Role of microtubule-associated protein tau phosphorylation in Alzheimer's disease.
Ma RH, Zhang Y, Hong XY, Zhang JF, Wang JZ, Liu GP. Ma RH, et al. J Huazhong Univ Sci Technolog Med Sci. 2017 Jun;37(3):307-312. doi: 10.1007/s11596-017-1732-x. Epub 2017 Jun 6. J Huazhong Univ Sci Technolog Med Sci. 2017. PMID: 28585125 Review.
Cited by
- Antibody against early driver of neurodegeneration cis P-tau blocks brain injury and tauopathy.
Kondo A, Shahpasand K, Mannix R, Qiu J, Moncaster J, Chen CH, Yao Y, Lin YM, Driver JA, Sun Y, Wei S, Luo ML, Albayram O, Huang P, Rotenberg A, Ryo A, Goldstein LE, Pascual-Leone A, McKee AC, Meehan W, Zhou XZ, Lu KP. Kondo A, et al. Nature. 2015 Jul 23;523(7561):431-436. doi: 10.1038/nature14658. Epub 2015 Jul 15. Nature. 2015. PMID: 26176913 Free PMC article. - Disturb mitochondrial associated proteostasis: Neurodegeneration and imperfect ageing.
Jagtap YA, Kumar P, Kinger S, Dubey AR, Choudhary A, Gutti RK, Singh S, Jha HC, Poluri KM, Mishra A. Jagtap YA, et al. Front Cell Dev Biol. 2023 Mar 10;11:1146564. doi: 10.3389/fcell.2023.1146564. eCollection 2023. Front Cell Dev Biol. 2023. PMID: 36968195 Free PMC article. Review. - Nebula/DSCR1 upregulation delays neurodegeneration and protects against APP-induced axonal transport defects by restoring calcineurin and GSK-3β signaling.
Shaw JL, Chang KT. Shaw JL, et al. PLoS Genet. 2013;9(9):e1003792. doi: 10.1371/journal.pgen.1003792. Epub 2013 Sep 26. PLoS Genet. 2013. PMID: 24086147 Free PMC article. - The Role of Mitochondrial Impairment in Alzheimer´s Disease Neurodegeneration: The Tau Connection.
Quntanilla RA, Tapia-Monsalves C. Quntanilla RA, et al. Curr Neuropharmacol. 2020;18(11):1076-1091. doi: 10.2174/1570159X18666200525020259. Curr Neuropharmacol. 2020. PMID: 32448104 Free PMC article. Review. - Novel p75 neurotrophin receptor ligand stabilizes neuronal calcium, preserves mitochondrial movement and protects against HIV associated neuropathogenesis.
Meeker RB, Poulton W, Clary G, Schriver M, Longo FM. Meeker RB, et al. Exp Neurol. 2016 Jan;275 Pt 1(0 1):182-98. doi: 10.1016/j.expneurol.2015.09.012. Epub 2015 Sep 28. Exp Neurol. 2016. PMID: 26424436 Free PMC article.
References
- Bereiter-Hahn J, Jendrach M. Mitochondrial dynamics. Int Rev Cell Mol Biol. 2010;284:1–65. - PubMed
- Bershadsky AD, Gelfand VI, Svitkina TM, Tint IS. Microtubules in mouse embryo fibroblasts extracted with Triton X-100. Cell Biol Int Rep. 1978;2:425–432. - PubMed
- Chen J, Kanai Y, Cowan NJ, Hirokawa N. Projection domains of MAP2 and tau determine spacings between microtubules in dendrites and axons. Nature. 1992;360:674–677. - PubMed
Publication types
MeSH terms
Substances
LinkOut - more resources
Full Text Sources
Other Literature Sources
Medical


