Citrus aurantium flavonoids inhibit adipogenesis through the Akt signaling pathway in 3T3-L1 cells - PubMed (original) (raw)
Citrus aurantium flavonoids inhibit adipogenesis through the Akt signaling pathway in 3T3-L1 cells
Gon-Sup Kim et al. BMC Complement Altern Med. 2012.
Abstract
Background: Obesity is a health hazard that is associated with a number of diseases and metabolic abnormalities, such as type-2 diabetes, hypertension, dyslipidemia, and coronary heart disease. In the current study, we investigated the effects of Citrus aurantium flavonoids (CAF) on the inhibition of adipogenesis and adipocyte differentiation in 3T3-L1 cells.
Methods: During adipocyte differentiation, 3T3-L1 cells were treated with 0, 10, and 50 μg/ml CAF, and then the mRNA and protein expression of adipogenesis-related genes was assayed. We examined the effect of CAF on level of phosphorylated Akt in 3T3-L1 cells treated with CAF at various concentrations during adipocyte differentiation.
Results: The insulin-induced expression of C/EBPβ and PPARγ mRNA and protein were significantly down-regulated in a dose-dependent manner following CAF treatment. CAF also dramatically decreased the expression of C/EBPα, which is essential for the acquisition of insulin sensitivity by adipocytes. Moreover, the expression of the aP2 and FAS genes, which are involved in lipid metabolism, decreased dramatically upon treatment with CAF. Interestingly, CAF diminished the insulin-stimulated serine phosphorylation of Akt (Ser473) and GSK3β (Ser9), which may reduce glucose uptake in response to insulin and lipid accumulation. Furthermore, CAF not only inhibited triglyceride accumulation during adipogenesis but also contributed to the lipolysis of adipocytes.
Conclusions: In the present study, we demonstrate that CAF suppressed adipogenesis in 3T3-L1 adipocytes. Our results indicated that CAF down-regulates the expression of C/EBPβ and subsequently inhibits the activation of PPARγ and C/EBPα. The anti-adipogenic activity of CAF was mediated by the inhibition of Akt activation and GSK3β phosphorylation, which induced the down-regulation of lipid accumulation and lipid metabolizing genes, ultimately inhibiting adipocyte differentiation.
Figures
Figure 1
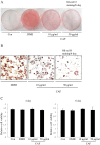
Effect of CAF on lipid accumulation of 3T3-L1 adipocytes. Confluent 3T3-L1 preadipocytes differentiated into adipocytes in medium containing different concentrations of CAF for 6 days (from day 0 to 6). Con, 3T3-L1 preadipocytes; DMII, fully differentiated adipocytes; 10 μg/ml, fully differentiated adipocytes (DMII + 10 μg/ml CAF); 50 μg/ml, fully differentiated adipocytes (DMII + 50 μg/ml CAF). (A, B) Inhibitory effects of CAF on lipid accumulation in 3T3-L1 adipocytes. The intracellular lipid accumulation quantified by Oil-red O staining and also optically observed by an inverted microscope. Oil-red O staining assay for lipid droplets was performed on day 6 after induction of differentiation. (C) Effect of CAF on cell viability in preadipocyte and differentiated adipocytes. These data were presented as relative cell viability values. Data are mean ± SD values of at least three independent experiments. Each experiment was performed in triplicate.
Figure 2
Effect of CAF on the expression of adipogenesis-related genes in 3T3-L1 adipocytes. 3T3-L1 cells were differentiated in the absence or presence of CAF for 4 or 6 days. (A) CAF inhibited the expression of adipocyte-specific transcription factors, C/EBPβ and PPARγ mRNA during adipocyte differentiation. The differentiation of 3T3-L1 preadipocytes was induced by DMII medium in the absence or presence of 10 and 50 μg/ml CAF. Total RNA was isolated from 3T3-L1 adipocytes at day 4 and day 6 after induction of differentiation. The expression of C/EBPβ and PPARγ was examined by RT-PCR. (B) The relative expression of adipocyte-specific genes after treating CAF for 4 or 6 days. All gene expressions were normalized using β-actin as a reference gene. The data shown are representative of three independent experiments. (*) p < 0.05, (**) P < 0.01 versus the control (DMII) group at each gene expression. (C) CAF inhibited the expression of adipogenesis-related genes in 3T3-L1 adipocytes. Total cell lysates were isolated from 3T3-L1 adipocytes at day 4 and day 6 after induction of differentiation. Immunoblotting analysis was performed as described in Materials and Methods. (D) The relative expression of adipogenesis-related genes after treating CAF for 4 or 6 days. The data shown are representative of three independent experiments. (*) p < 0.05, (**) P < 0.01, (***) P < 0.001 versus the control (DMII) group at each gene expression.
Figure 3
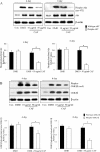
Effect of CAF on phosophorylation of Akt and GSK3β during 3T3-L1 differentiation. 3T3-L1 preadipocytes were differentiated in the absence or in the presence of CAF for 6 days. (A) Immunoblotting analysis for wild type Akt and pAkt (Ser 473) was described under Materials and Methods. These experiments were conducted as independent experiments in triplicate. Data represent the mean ± SD. (*) p < 0.05. (B) Immunoblotting analysis for wild type GSK3β and pGSK3β (Ser-9) was described under Materials and Methods. These experiments were performed as independent experiments in triplicate. Data represent the mean ± SD. (*) p < 0.05.
Figure 4
Effect of CAF on triglyceride accumulation and lypolytic activity in 3T3-L1 adipocytes. Confluent 3T3-L1 preadipocytes were differentiated into adipocytes in DMII medium for 6 days. (A) CAF reduced TG content during differentiation of 3T3-L1 cells. 3T3-L1 preadipocytes were differentiated in the absence or presence of CAF for 4 or 6 days, and the lipid accumulation was measured by triglyceride assay. Data are mean ± SD values of at least three independent experiments. (*) p < 0.05, (**) P < 0.01 compared with the differentiated adipocytes (control). (B) CAF increased lipolytic activity in 3T3-L1 adipocytes. The lypolytic activity of CAF was determined by measuring glycerol levels secreted in medium. All experiments were performed on triplicates for each treatment. Values represent mean ± SD. (*) p < 0.05, (**) P < 0.01 compared with the untreated adipocytes (control).
Similar articles
- Centipede grass exerts anti-adipogenic activity through inhibition of C/EBPβ, C/EBPα, and PPARγ expression and the AKT signaling pathway in 3T3-L1 adipocytes.
Park HJ, Chung BY, Lee MK, Song Y, Lee SS, Chu GM, Kang SN, Song YM, Kim GS, Cho JH. Park HJ, et al. BMC Complement Altern Med. 2012 Nov 26;12:230. doi: 10.1186/1472-6882-12-230. BMC Complement Altern Med. 2012. PMID: 23181522 Free PMC article. - Coprinus comatus cap inhibits adipocyte differentiation via regulation of PPARγ and Akt signaling pathway.
Park HJ, Yun J, Jang SH, Kang SN, Jeon BS, Ko YG, Kim HD, Won CK, Kim GS, Cho JH. Park HJ, et al. PLoS One. 2014 Sep 2;9(9):e105809. doi: 10.1371/journal.pone.0105809. eCollection 2014. PLoS One. 2014. PMID: 25181477 Free PMC article. - 6-gingerol prevents adipogenesis and the accumulation of cytoplasmic lipid droplets in 3T3-L1 cells.
Tzeng TF, Liu IM. Tzeng TF, et al. Phytomedicine. 2013 Apr 15;20(6):481-7. doi: 10.1016/j.phymed.2012.12.006. Epub 2013 Jan 28. Phytomedicine. 2013. PMID: 23369342 - Molecular mechanism of down-regulating adipogenic transcription factors in 3T3-L1 adipocyte cells by bioactive anti-adipogenic compounds.
Guru A, Issac PK, Velayutham M, Saraswathi NT, Arshad A, Arockiaraj J. Guru A, et al. Mol Biol Rep. 2021 Jan;48(1):743-761. doi: 10.1007/s11033-020-06036-8. Epub 2020 Dec 4. Mol Biol Rep. 2021. PMID: 33275195 Review. - Critical review on anti-obesity effects of phytochemicals through Wnt/β-catenin signaling pathway.
Luo J, Yu Z, Tovar J, Nilsson A, Xu B. Luo J, et al. Pharmacol Res. 2022 Oct;184:106461. doi: 10.1016/j.phrs.2022.106461. Epub 2022 Sep 21. Pharmacol Res. 2022. PMID: 36152739 Review.
Cited by
- miRNAs and Novel Food Compounds Related to the Browning Process.
Lorente-Cebrián S, Herrera K, I Milagro F, Sánchez J, de la Garza AL, Castro H. Lorente-Cebrián S, et al. Int J Mol Sci. 2019 Nov 28;20(23):5998. doi: 10.3390/ijms20235998. Int J Mol Sci. 2019. PMID: 31795191 Free PMC article. Review. - Insights on Dietary Polyphenols as Agents against Metabolic Disorders: Obesity as a Target Disease.
Aloo SO, Ofosu FK, Kim NH, Kilonzi SM, Oh DH. Aloo SO, et al. Antioxidants (Basel). 2023 Feb 8;12(2):416. doi: 10.3390/antiox12020416. Antioxidants (Basel). 2023. PMID: 36829976 Free PMC article. Review. - Combination of Ethanolic Extract of Citrus aurantifolia Peels with Doxorubicin Modulate Cell Cycle and Increase Apoptosis Induction on MCF-7 Cells.
Adina AB, Goenadi FA, Handoko FF, Nawangsari DA, Hermawan A, Jenie RI, Meiyanto E. Adina AB, et al. Iran J Pharm Res. 2014 Summer;13(3):919-26. Iran J Pharm Res. 2014. PMID: 25276192 Free PMC article. - Citrus Flavonoids as Promising Phytochemicals Targeting Diabetes and Related Complications: A Systematic Review of In Vitro and In Vivo Studies.
Gandhi GR, Vasconcelos ABS, Wu DT, Li HB, Antony PJ, Li H, Geng F, Gurgel RQ, Narain N, Gan RY. Gandhi GR, et al. Nutrients. 2020 Sep 23;12(10):2907. doi: 10.3390/nu12102907. Nutrients. 2020. PMID: 32977511 Free PMC article. - Antidiabetic activities of Bolanthus spergulifolius (Caryophyllaceae) extracts on insulin-resistant 3T3-L1 adipocytes.
Derici GE, Özdaş S, Canatar İ, Koç M. Derici GE, et al. PLoS One. 2021 Jun 16;16(6):e0252707. doi: 10.1371/journal.pone.0252707. eCollection 2021. PLoS One. 2021. PMID: 34133443 Free PMC article.
References
Publication types
MeSH terms
Substances
LinkOut - more resources
Full Text Sources
Medical
Molecular Biology Databases
Research Materials
Miscellaneous


