MicroRNAs in cerebrospinal fluid identify glioblastoma and metastatic brain cancers and reflect disease activity - PubMed (original) (raw)
MicroRNAs in cerebrospinal fluid identify glioblastoma and metastatic brain cancers and reflect disease activity
Nadiya M Teplyuk et al. Neuro Oncol. 2012 Jun.
Abstract
An accurate, nonsurgical diagnostic test for brain tumors is currently unavailable, and the methods of monitoring disease progression are not fully reliable. MicroRNA profiling of biological fluids has recently emerged as a diagnostic tool for several pathologic conditions. Here we tested whether microRNA profiling of cerebrospinal fluid (CSF) enables detection of glioblastoma, discrimination between glioblastoma and metastatic brain tumors, and reflects disease activity. We determined CSF levels of several cancer-associated microRNAs for 118 patients diagnosed with different types of brain cancers and nonneoplastic neuropathologies by quantitative reverse transcription PCR analysis. The levels of miR-10b and miR-21 are found significantly increased in the CSF of patients with glioblastoma and brain metastasis of breast and lung cancer, compared with tumors in remission and a variety of nonneoplastic conditions. Members of the miR-200 family are highly elevated in the CSF of patients with brain metastases but not with any other pathologic conditions, allowing discrimination between glioblastoma and metastatic brain tumors. Quantification of as few as 7 microRNAs in CSF enables differential recognition of glioblastoma and metastatic brain cancer using computational machine learning tools (Support Vector Machine) with high accuracy (91%-99%) on a test set of samples. Furthermore, we show that disease activity and treatment response can be monitored by longitudinal microRNA profiles in the CSF of glioblastoma and non-small cell lung carcinoma patients. This study demonstrates that microRNA-based detection of brain malignancies can be reliably performed and that microRNAs in CSF can serve as biomarkers of treatment response in brain cancers.
Figures
Fig. 1.
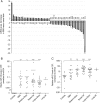
MiR-10b and miR-21 upregulation in GBM and their CSF levels in patients with GBM or metastatic brain cancer and nonneoplastic controls. (A) MiRNAs were deregulated in GBM more than 2-fold compared with normal brains. MiRNA levels were obtained by the analysis of TCGA miRNA microarray data; error bars represent standard deviation between individual probe sets present for each miRNA on the arrays. (B) MiR-10b and (C) miR-21 levels were examined by qRT-PCR in CSF samples of neurological patients. Relative levels were normalized to miR-24, as described in Materials and Methods and demonstrated for individual CSF samples. Horizontal lines indicate arithmetic mean of miRNA levels for each group of patients: “Controls” = nonneoplastic neuropathologic cases, “GBM” = glioblastoma cases, “Breast to Brain” and “Lung to Brain” = breast and lung cancer brain metastasis, “Breast LM” and “Lung LM” = breast and lung cancer leptomeningeal metastasis, respectively. Differences between group means have been determined by nonparametric Wilcoxon signed rank test, and the significance is indicated by asterisks: *P < .05, **P < .001, ***P < .0001. MiR-10b and miR-21 CSF levels normalized to miR-125b are presented in
Supplementary Fig. S2
A and S2B.
Fig. 2.
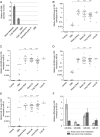
Detection of miRNAs of miR-200 family in metastatic brain cancer patients. (A) MiR-200b expression levels were examined by qRT-PCR in various primary and metastatic brain tumor tissue specimens and normalized to miR-24, as described in Materials and Methods. Error bars indicate standard errors between technical duplicates. PNET = primitive neuroectodermal brain tumor. MiR-200a (B), miR-200b (C), miR-200c (D), and miR-141 (E) levels were examined by qRT-PCR in the CSF samples of neurological patients. MiRNA levels are normalized to miR-24 and demonstrated for individual patients. There are 9 samples with undetectable miR-200 levels (values = 0) present in the GBM group. Horizontal lines indicate arithmetic mean for each group of samples. Differences between group means that reached statistical significance, as determined by a nonparametric Wilcoxon signed rank test, are indicated with asterisks: *P < .05, **P < .001, ***P < .0001. Corresponding values normalized to miR-125b are presented in
Supplementary Fig. S2
C–F. (F) The average levels of miR-200a/miR-200b and miR-141/miR-200c cluster miRNAs in CSF of metastatic brain cancer patients. The error bars represent the standard error of the mean for each group of patients.
Fig. 3.
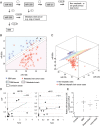
Computational classification of high-grade brain malignancies based on CSF miRNA profiling and the origin of miRNA in CSF. (A) Classification tree of brain cancer patients based on CSF miRNA biomarkers (miR-10b, -21, and -200). (B and C) Application of SVM with linear kernel to classification of specimens: (B) classification of GBM vs metastatic brain cancer on the basis of Ct levels of 2 miRNAs (miR-200a and miR-125b) in the CSF. The Ct values of corresponding miRNAs are plotted. A specimen is classified as GBM/metastasis depending on whether the Ct levels of the 2 miRNAs place it above/below the separation line. The line illustrates the automatically generated classifier. The arrow depicts a misclassified sample and the arrowhead depicts a “confused” sample. (C) Classification of GBM and brain metastasis versus nonneoplastic control cases on the basis of Ct levels of 3 miRNAs (miR-10b, miR-200a, and miR-125b) in the CSF. A specimen is classified to a particular group depending on whether its Ct levels place it below/above the separation plane. The plane illustrates the automatically generated classifier. (D) The relation between miR-10b and miR-21 levels in brain tumors and matching CSF samples collected from the same patients. The Pearson coefficients (r) of linear regression between 2 data sets were calculated for each miRNA. (E) Relative miR-124a levels were determined in CSF of a randomly selected cohort of control and brain cancer patients by qRT-PCR analysis. Relative levels were normalized to miR-24, as described in Materials and Methods and demonstrated for individual CSF samples. Horizontal lines indicate arithmetic mean of miRNA levels for each group of patients.
Fig. 4.
CSF levels of miRNA markers in metastatic lung cancer and GBM patients during treatment with erlotinib. MiRNA levels were examined by qRT-PCR in the CSF samples of lung cancer (A and C) and GBM patients (B) during the time course of erlotinib treatment. The disease progression and drug response were concomitantly monitored by MRI, as follows. For Patient A: serial axial postgadolinium MRIs of the lung cancer patient's brain during the course of progression of disease and stability and improvement on MRI with escalating doses of erlotinib. A: At 0 weeks, while the patient was taking erlotinib, there was no leptomeningeal and parenchymal enhancement and CSF cytology was negative; B: at 3 weeks progression on erlotinib at 150 mg daily dosing with new cerebellar leptomeningeal enhancement (small arrows) and nodule (large arrow), erlotinib increased to 600 mg every 4 days at 9 weeks; C: at 29 weeks on showing stable leptomeningeal enhancement and nodule; D: at 40 weeks showing reduction in leptomeningeal enhancement and nodule, erlotinib increased to 900 mg every 4 days at 41 weeks; E: at 64 weeks, after 6 cycles of chemotherapy with carboplatinum and pemetrexed due to lung cancer progression, showing further reduction in leptomeningeal enhancement and nodule has disappeared. For Patient B: A: At 2 weeks for patient with recurrent GBM with prominent mass effect and enhancement felt to be radiation changes rather than tumor based on MRI spectroscopy and FDG-PET scan, on erlotinib at 600 mg every 4 days; B: at 26 weeks on treatment, showing progression on MRI with new lesion (arrow) concerning for tumor; C: at 27 weeks on treatment showing hypermetabolic area (arrow) on PET consistent with tumor and biopsy confirmed. For Patient C: had inadequate treatment due to functional status and rapidly progressed over a few weeks, which was reflected by an increase in levels of miR-200 family members in a short interval.
Comment in
- Neuro-oncology: MicroRNAs in CSF-biomarkers of brain cancers and disease activity.
Malpass K. Malpass K. Nat Rev Neurol. 2012 May 15;8(6):297. doi: 10.1038/nrneurol.2012.85. Nat Rev Neurol. 2012. PMID: 22584160 No abstract available.
Similar articles
- Detection of circulating tumor DNA from non-small cell lung cancer brain metastasis in cerebrospinal fluid samples.
Ma C, Yang X, Xing W, Yu H, Si T, Guo Z. Ma C, et al. Thorac Cancer. 2020 Mar;11(3):588-593. doi: 10.1111/1759-7714.13300. Epub 2020 Jan 13. Thorac Cancer. 2020. PMID: 31944608 Free PMC article. - A differentially expressed set of microRNAs in cerebro-spinal fluid (CSF) can diagnose CNS malignancies.
Drusco A, Bottoni A, Laganà A, Acunzo M, Fassan M, Cascione L, Antenucci A, Kumchala P, Vicentini C, Gardiman MP, Alder H, Carosi MA, Ammirati M, Gherardi S, Luscrì M, Carapella C, Zanesi N, Croce CM. Drusco A, et al. Oncotarget. 2015 Aug 28;6(25):20829-39. doi: 10.18632/oncotarget.4096. Oncotarget. 2015. PMID: 26246487 Free PMC article. - Cerebrospinal fluid exosomal microRNAs as biomarkers for diagnosing or monitoring the progression of non-small cell lung cancer with leptomeningeal metastases.
Li H, Xia M, Zheng S, Lin Y, Yu T, Xie Y, Shen Y, Liu X, Qian X, Yin Z. Li H, et al. Biotechnol Genet Eng Rev. 2024 Apr;40(1):359-380. doi: 10.1080/02648725.2023.2183613. Epub 2023 Feb 28. Biotechnol Genet Eng Rev. 2024. PMID: 36852928 - Cerebrospinal fluid microRNAs as diagnostic biomarkers in brain tumors.
Kopkova A, Sana J, Fadrus P, Slaby O. Kopkova A, et al. Clin Chem Lab Med. 2018 May 24;56(6):869-879. doi: 10.1515/cclm-2017-0958. Clin Chem Lab Med. 2018. PMID: 29451858 Review. - miRNA signature in glioblastoma: Potential biomarkers and therapeutic targets.
Rezaei O, Honarmand K, Nateghinia S, Taheri M, Ghafouri-Fard S. Rezaei O, et al. Exp Mol Pathol. 2020 Dec;117:104550. doi: 10.1016/j.yexmp.2020.104550. Epub 2020 Oct 1. Exp Mol Pathol. 2020. PMID: 33010295 Review.
Cited by
- Correlation of microRNA-372 upregulation with poor prognosis in human glioma.
Li G, Zhang Z, Tu Y, Jin T, Liang H, Cui G, He S, Gao G. Li G, et al. Diagn Pathol. 2013 Jan 8;8:1. doi: 10.1186/1746-1596-8-1. Diagn Pathol. 2013. PMID: 23298385 Free PMC article. - Nanoparticles in 472 Human Cerebrospinal Fluid: Changes in Extracellular Vesicle Concentration and miR-21 Expression as a Biomarker for Leptomeningeal Metastasis.
Lee KY, Im JH, Lin W, Gwak HS, Kim JH, Yoo BC, Kim TH, Park JB, Park HJ, Kim HJ, Kwon JW, Shin SH, Yoo H, Lee C. Lee KY, et al. Cancers (Basel). 2020 Sep 24;12(10):2745. doi: 10.3390/cancers12102745. Cancers (Basel). 2020. PMID: 32987772 Free PMC article. - miR-497 and 219 in blood aid meningioma classification.
Abdelrahman A, Negroni C, Sahm F, Adams CL, Urbanic-Purkart T, Khalil M, Vergura R, Morelli C, Hanemann CO. Abdelrahman A, et al. J Neurooncol. 2022 Oct;160(1):137-147. doi: 10.1007/s11060-022-04126-0. Epub 2022 Sep 8. J Neurooncol. 2022. PMID: 36076132 - Oligonucleotide Therapeutics as a New Class of Drugs for Malignant Brain Tumors: Targeting mRNAs, Regulatory RNAs, Mutations, Combinations, and Beyond.
Krichevsky AM, Uhlmann EJ. Krichevsky AM, et al. Neurotherapeutics. 2019 Apr;16(2):319-347. doi: 10.1007/s13311-018-00702-3. Neurotherapeutics. 2019. PMID: 30644073 Free PMC article. Review. - The detection of microRNA associated with Alzheimer's disease in biological fluids using next-generation sequencing technologies.
Cheng L, Quek CY, Sun X, Bellingham SA, Hill AF. Cheng L, et al. Front Genet. 2013 Aug 8;4:150. doi: 10.3389/fgene.2013.00150. eCollection 2013. Front Genet. 2013. PMID: 23964286 Free PMC article.
References
- Filippini G, Falcone C, Boiardi A, et al. Prognostic factors for survival in 676 consecutive patients with newly diagnosed primary glioblastoma. Neuro Oncol. 2008;10(1):79–87. doi:10.1215/15228517-2007-038. - DOI - PMC - PubMed
- Grewal J, Saria MG, Kesari S. Novel approaches to treating leptomeningeal metastases. J Neurooncol. 2012;106(2):225–234. doi:10.1007/s11060-011-0686-2. - DOI - PubMed
- Valadi H, Ekstrom K, Bossios A, et al. Exosome-mediated transfer of mRNAs and microRNAs is a novel mechanism of genetic exchange between cells. Nat Cell Biol. 2007;9(6):654–659. doi:10.1038/ncb1596. - DOI - PubMed
- Skog J, Wurdinger T, van Rijn S, et al. Glioblastoma microvesicles transport RNA and proteins that promote tumour growth and provide diagnostic biomarkers. Nat Cell Biol. 2008;10(12):1470–1476. doi:10.1038/ncb1800. - DOI - PMC - PubMed
- Chen X, Ba Y, Ma L, et al. Characterization of microRNAs in serum: a novel class of biomarkers for diagnosis of cancer and other diseases. Cell Res. 2008;18(10):997–1006. doi:10.1038/cr.2008.282. - DOI - PubMed
Publication types
MeSH terms
Substances
Grants and funding
- K08CA124804/CA/NCI NIH HHS/United States
- R01 CA138734/CA/NCI NIH HHS/United States
- R01CA138734-01A1/CA/NCI NIH HHS/United States
- P30 CA023100/CA/NCI NIH HHS/United States
- 3P30CA023100-25S8/CA/NCI NIH HHS/United States
LinkOut - more resources
Full Text Sources
Other Literature Sources
Medical


