The lipogenic transcription factor ChREBP dissociates hepatic steatosis from insulin resistance in mice and humans - PubMed (original) (raw)
Clinical Trial
. 2012 Jun;122(6):2176-94.
doi: 10.1172/JCI41636. Epub 2012 May 1.
Pierre-Damien Denechaud, Maud Lemoine, Céline Robichon, Marthe Moldes, Justine Bertrand-Michel, Vlad Ratziu, Lawrence Serfaty, Chantal Housset, Jacqueline Capeau, Jean Girard, Hervé Guillou, Catherine Postic
Affiliations
- PMID: 22546860
- PMCID: PMC3366390
- DOI: 10.1172/JCI41636
Clinical Trial
The lipogenic transcription factor ChREBP dissociates hepatic steatosis from insulin resistance in mice and humans
Fadila Benhamed et al. J Clin Invest. 2012 Jun.
Abstract
Nonalcoholic fatty liver disease (NAFLD) is associated with all features of the metabolic syndrome. Although deposition of excess triglycerides within liver cells, a hallmark of NAFLD, is associated with a loss of insulin sensitivity, it is not clear which cellular abnormality arises first. We have explored this in mice overexpressing carbohydrate responsive element-binding protein (ChREBP). On a standard diet, mice overexpressing ChREBP remained insulin sensitive, despite increased expression of genes involved in lipogenesis/fatty acid esterification and resultant hepatic steatosis (simple fatty liver). Lipidomic analysis revealed that the steatosis was associated with increased accumulation of monounsaturated fatty acids (MUFAs). In primary cultures of mouse hepatocytes, ChREBP overexpression induced expression of stearoyl-CoA desaturase 1 (Scd1), the enzyme responsible for the conversion of saturated fatty acids (SFAs) into MUFAs. SFA impairment of insulin-responsive Akt phosphorylation was therefore rescued by the elevation of Scd1 levels upon ChREBP overexpression, whereas pharmacological or shRNA-mediated reduction of Scd1 activity decreased the beneficial effect of ChREBP on Akt phosphorylation. Importantly, ChREBP-overexpressing mice fed a high-fat diet showed normal insulin levels and improved insulin signaling and glucose tolerance compared with controls, despite having greater hepatic steatosis. Finally, ChREBP expression in liver biopsies from patients with nonalcoholic steatohepatitis was increased when steatosis was greater than 50% and decreased in the presence of severe insulin resistance. Together, these results demonstrate that increased ChREBP can dissociate hepatic steatosis from insulin resistance, with beneficial effects on both glucose and lipid metabolism.
Figures
Figure 1. Overexpression of ChREBP in livers of mice leads to the induction of the entire lipogenic and esterification program.
C57BL/6J mice were injected intravenously with a single dose of 5 × 10⁹ pfu of GFP or ChREBP adenovirus at day 1. Four weeks later, mice were sacrificed and analyses were performed. (A) Ser196 phosphorylation level of ChREBP in livers of overnight fasted GFP and ChREBP mice. A representative Western blot is shown (n = 10–12 group). (B) Quantification of the ratio of Ser196 ChREBP phosphorylation compared with total ChREBP protein content is shown. ***P < 0.001 ChREBP versus GFP mice. (C) Nuclear ChREBP and SREBP-1c protein content in nuclear extracts from fed GFP versus ChREBP mice. Lamin A/C antibody was used as a loading control. A representative Western blot is shown (n = 10–12/group). mSREBP-1c, mature SREBP-1c. (D) Total ACACA, FASN, and SCD1 protein content in liver lysates from fed GFP and ChREBP mice. β-Actin antibody was used as a loading control. A representative Western blot is shown (n = 10–12/group). (E) qRT-PCR analysis of ChREBP, SREBP-1c, LXR, Pparg, Gck, Pklr, Acaca, Fasn, Scd1, Elovl6, and GPAT in livers of GFP versus ChREBP mice. Results are the mean ± SEM (n = 10–12/group). *P < 0.05, **P < 0.01 ChREBP versus GFP mice.
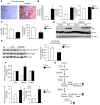
Figure 2. Overexpression of ChREBP leads to modification in hepatic lipid composition.
All analyses were carried out in fed GFP and ChREBP mice. Results are the mean ± SEM (n = 10–12/group, unless specified). (A) Oil Red O staining of liver sections (original magnification, ×40). (B) Liver TGs, DAG, and ceramide concentrations. (C) Liver G6P and glycogen content. (D) PKCε content in cytosol and plasma membrane (PM) from GFP and ChREBP mice. Insulin receptor antibody (IRβ) was used as a control of plasma membrane preparation purity, and β-actin antibody was used as a loading control. A representative Western blot is shown (n = 6–10/group). (E) Phosphorylation levels of NF-κB on Ser536 and total NF-κB p65 protein concentrations in livers of noninjected (NI), GFP, and ChREBP mice. A representative Western blot is shown (n = 6/group). Quantification of NF-κB p65 Ser536/NF-κB p65 is shown (n = 6/group). (F) Fatty acid composition and palmitoleate (C16:1n-7) and oleate (C18:1n-9) concentrations. PUFAs, polyunsaturated fatty acids. (G) Schematic representation of the enzymatic steps involved in fatty acid synthesis from glucose in liver. The enzymes controlled by ChREBP are indicated: L-PK, ACACA, FASN, SCD1, Elovl6, and GPAT. A black arrow shows the change in fatty acid composition caused by ChREBP overexpression. *P < 0.05 ChREBP versus GFP.
Figure 3. ChREBP-induced steatosis is not associated with insulin resistance.
(A) Glucose tolerance (1 g/kg), insulin tolerance (0.75 U/kg), and pyruvate tolerance (2 g/kg) tests were performed in GFP and ChREBP mice. *P < 0.05 ChREBP versus GFP mice. (B) Representative Western blot analysis of Ser473 phosphorylation in liver of fasted GFP and ChREBP mice. Quantification of the ratio of Ser473 Akt phosphorylation compared with total Akt protein content is shown. **P < 0.01 ChREBP versus GFP mice (n = 6–10 mice/group). (C) Total PCK1 and ChREBP protein content in liver lysates from overnight fasted GFP and ChREBP mice. GAPDH antibody was used as a loading control. A representative Western blot is shown (n = 6–8/group). Quantification of the ratio of PCK1 compared with GAPDH content is shown. *P < 0.05 ChREBP versus GFP mice (n = 6–10 mice/group). (D) qRT-PCR analysis of Pck1, Ppargc1a, Foxo1, Cpt1a, Ppara, and Fgf21 in livers from overnight fasted GFP and ChREBP mice. Results are the mean ± SEM (n = 6–8 mice/group). *P < 0.05, **P < 0.01 ChREBP versus GFP.
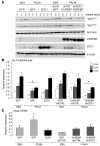
Figure 4. ChREBP overexpression protects against PALM-induced insulin resistance in primary cultured hepatocytes.
Twenty-four hours after plating, mouse hepatocytes were infected with 3 pfu of GFP or ChREBP adenovirus before being incubated for 24 hours with 0.48 mM albumin-bound PALM or 0.48 mM albumin-bound OLE/PALM, as described in the Methods section. An insulin (1 nM) time course was performed for 1, 2, 3, or 5 minutes. (A) Western blot analysis of insulin-mediated Akt phosphorylation on Ser473 and Thr308. Total Akt, ChREBP, SCD1, GFP, noncleaved caspase-3, and cleaved caspase-3 protein content was determined under similar culture conditions. Representative Western blots are shown (n = 6–10 independent cultures). (B). Quantification of the ratio of Ser473 Akt phosphorylation compared with total Akt protein content is shown. *P < 0.05 GFP PALM versus GFP BSA mice for equivalent time point (n = 6–10 independent cultures). (C). The Δ9-desaturation index was calculated as described in the Methods section. *P < 0.05 versus GFP PALM.
Figure 5. Inhibition of SCD1 activity in hepatocytes attenuates the protective effect of ChREBP on Akt phosphorylation.
Twenty-fours hour after plating, mouse hepatocytes were infected with 3 pfu of GFP or ChREBP adenovirus before being incubated for 24 hours with 0.48 mM albumin-bound PALM, with or without 10 nM SCD1 inhibitor (SCD1inhib) (36), as indicated. An insulin (1 nM) time course was performed for 2 and 5 minutes. (A) Western blot analysis of insulin-mediated Akt phosphorylation on Ser473, Thr308, total Akt, ChREBP, SCD1, and GFP protein content. Representative Western blots are shown (n = 4 independent cultures). β-Actin was used as a loading control. (B) Quantification of the ratio of Ser473 and Thr308 Akt phosphorylation compared with total Akt protein content is shown. *P < 0.05 ChREBP PALM plus SCD1inhib versus ChREBP PALM. (C) The Δ9-desaturation index was measured under similar culture conditions as indicated. *P < 0.05 ChREBP PALM plus SCD1inhib versus ChREBP PALM.
Figure 6. In vitro overexpression of SCD1 recapitulates the beneficial effect of ChREBP on Akt phosphorylation.
Twenty-four hours after plating, mouse hepatocytes were infected with a combination of adenovirus as indicated (GFP, SCD1, ChREBP, shCTRL, and/or shSCD1) and described in the Methods section. Cells were then incubated for 24 hours with BSA or 0.48 mM albumin-bound PALM. An insulin (1 nM) time course was performed for 2 and 5 minutes (n = 6 independent cultures). (A) Western blot analysis of insulin-mediated Akt phosphorylation on Ser473, Thr308, total Akt, ChREBP, and SCD1. Representative Western blots are shown. β-Actin was used as a loading control. (B) Quantification of the ratio of Thr308 compared with total Akt protein content is shown. *P < 0.05 compared with GFP BSA. (C) qRT-PCR analysis of chop mRNA under the indicated culture conditions. *P < 0.05 GFP PALM compared with GFP BSA.
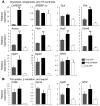
Figure 7. Gene expression in livers of HFD-fed ChREBP mice.
qRT-PCR analyses were carried out in HFD-fed (HFD) GFP and ChREBP mice, as described in the Methods section. GFP mice maintained on a standard CD for a similar number of weeks (10 weeks) were used as controls. Mice were sacrificed in the fasted state. (A) qRT-PCR analysis of ChREBP and genes involved in the glycolytic (Gck, Pklr), lipogenic (SREBP-1c, Acaca, Fasn, Scd1, Elovl6), and TG synthesis (Dgat1, Dgat2, GPAT) pathways. (B) qRT-PCR analysis of genes involved in fat uptake (Cd36), β-oxidation (Cpt1a, Fgf21), and export (MTP). Results are the mean ± SEM (n = 8–10/group). *P < 0.05, **P < 0.01 HFD-fed ChREBP versus HFD-fed GFP mice.
Figure 8. Exacerbated steatosis in HFD-fed ChREBP mice.
Analyses were carried out in HFD-fed GFP and HFD-fed ChREBP mice, as described in the Methods section. GFP mice maintained on a standard CD for a similar number of weeks were used as controls. Mice were sacrificed in the fasted state. (A) Liver macroscopy and Oil Red O staining of liver sections (original magnification, ×40). (B) Liver and adipose tissue weight (epididymal) (expressed as g/g of body weight [BW]). (C) Liver TGs and diacylglycerol concentrations. (D) qRT-PCR analysis of Tnfa, Il6, and chop. (E) Analysis of the Δ9-desaturation index (MUFA/SFA ratio). (F) Percentage of cellular fatty acid content. Nine lipid species (as indicated) were analyzed and used to assess the quality of the steatosis generated. Results are the mean ± SEM (n = 6–8/group). #P < <0.05 HFD-fed GFP versus CD-fed GFP mice; *P < 0.05, **P < 0.01 HFD-fed ChREBP versus HFD-fed GFP mice; †P < 0.05, ††P < 0.01 HFD versus CD.
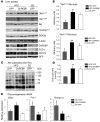
Figure 9. Improved Akt phosphorylation in livers of HFD-fed ChREBP mice.
All analyses were carried out in HFD-fed GFP and ChREBP mice, as described in the Methods section. GFP mice maintained on a standard CD for a similar number of weeks were used as controls. Mice were sacrificed in the fasted state. (A) Ser473, Thr308 Akt phosphorylation, and Ser9 GSK3β phosphorylation in livers of overnight fasted CD-fed GFP, HFD-fed GFP, and HFD-fed ChREBP mice. Total protein content of Akt, GSK3β ChREBP, SCD1, CRTC2, and GFP are shown. Representative Western blots are shown. β-Actin was used as a loading control. Samples were run on the same gel, but lanes were not contiguous. (B) Quantification of the ratios of Ser473 and Thr308 Akt phosphorylation compared with total Akt protein content are shown. (C) Phosphorylation of Akt substrates (ranging from 55 to 250 kDa). A representative Western blot is shown. Samples were run on the same gel, but lanes were not contiguous. (D) Liver pyruvate concentrations. (E) qRT-PCR analysis of genes involved in the gluconeogenic pathway (G6pc, Pck1, Ppargc1a). Results are the mean ± SEM (n = 8–10/group). #P < 0.05 HFD-fed GFP versus CD-fed GFP mice; *P < 0.05, **P < 0.01 HFD-fed ChREBP versus HFD-fed GFP mice.
Figure 10. Improved glucose tolerance and insulin resistance in HFD-fed ChREBP mice.
All analyses were carried out in HFD-fed GFP and ChREBP mice, as described in the Methods section. GFP mice maintained on a standard CD for a similar number of weeks were used as controls. (A) Glucose tolerance tests (1 g/kg) were performed in GFP and ChREBP mice. (B) Fasting insulin concentrations. (C) Fasting FGF21 concentrations. Results are the mean ± SEM (n = 8–10/group). #P < 0.05 HFD-fed GFP versus CD-fed GFP mice; *P < 0.05, **P < 0.01 HFD-fed ChREBP versus HFD-fed GFP mice.
Figure 11. ChREBP expression is positively related to the degree of hepatic steatosis and inversely to insulin resistance in patients with NASH.
CHREBP mRNA levels in livers of fasted patients with histologically proven NASH. Histologic diagnosis of NASH was defined as steatosis of more than 20% and the presence of either hepatocyte ballooning or intralobular hepatocyte necrosis (48). (A) qRT-PCR analysis of CHREBP in livers of patients with steatosis under (n = 12) or above 50% (n = 13). (B) qRT-PCR analysis of CHREBP in livers of patients with HOMA index values of less than 4.8 (n = 12) versus those with HOMA index values of more than 4.8 (n = 13). (C) Correlations between the HOMA index (_r_2 = 0.25; P = 0.03) or (D) the degree of steatosis (_r_2 = 0.27; P = 0.02) and ChREBP expression in livers of these patients were performed. Symbols represent individual patients.
Figure 12. Antilipotoxic effect of ChREBP overexpression in mouse liver.
Upon ChREBP overexpression in livers of mice fed a HFD, glycolysis and lipogenesis are stimulated, leading to the development of hepatic steatosis. ChREBP overexpression by stimulating SCD1 activity leads to a modification in lipid composition (namely a change in the monounsaturated [MUFA] to saturated [SFA] ratio) and dissociates hepatic steatosis from insulin resistance. Increased phosphorylation of Akt (Ser473 and Thr308) and of downstream substrates was measured in HFD-fed ChREBP mice, and glucose tolerance was improved. Our results provide insights into the causal relationship between hepatic steatosis and insulin resistance and demonstrate that increasing the lipogenic pathway may protect against insulin resistance by raising beneficial lipid species. CRTC2, CREB-regulated transcription coactivator 2; PPARGC1A, peroxisome proliferator-activated receptor γ coactivator 1-α; PCK1, phosphoenolpyruvate carboxykinase.
Comment in
- ChREBP in NASH - a liver transcription factor comes in from the cold.
Charlton MR. Charlton MR. J Hepatol. 2013 Jul;59(1):178-9. doi: 10.1016/j.jhep.2013.03.011. Epub 2013 Mar 21. J Hepatol. 2013. PMID: 23523581 No abstract available.
Similar articles
- Salt-inducible kinase 2 links transcriptional coactivator p300 phosphorylation to the prevention of ChREBP-dependent hepatic steatosis in mice.
Bricambert J, Miranda J, Benhamed F, Girard J, Postic C, Dentin R. Bricambert J, et al. J Clin Invest. 2010 Dec;120(12):4316-31. doi: 10.1172/JCI41624. Epub 2010 Nov 15. J Clin Invest. 2010. PMID: 21084751 Free PMC article. - Hepatic stearoyl CoA desaturase 1 deficiency increases glucose uptake in adipose tissue partially through the PGC-1α-FGF21 axis in mice.
Aljohani A, Khan MI, Bonneville A, Guo C, Jeffery J, O'Neill L, Syed DN, Lewis SA, Burhans M, Mukhtar H, Ntambi JM. Aljohani A, et al. J Biol Chem. 2019 Dec 20;294(51):19475-19485. doi: 10.1074/jbc.RA119.009868. Epub 2019 Nov 5. J Biol Chem. 2019. PMID: 31690632 Free PMC article. - Downregulated microRNA-130b-5p prevents lipid accumulation and insulin resistance in a murine model of nonalcoholic fatty liver disease.
Liu X, Chen S, Zhang L. Liu X, et al. Am J Physiol Endocrinol Metab. 2020 Jul 1;319(1):E34-E42. doi: 10.1152/ajpendo.00528.2019. Epub 2020 Mar 31. Am J Physiol Endocrinol Metab. 2020. PMID: 32228319 - [Can the hyperactivity of lipogenesis cause hepatic steatosis? A role for ChREBP].
Robichon C, Girard J, Postic C. Robichon C, et al. Med Sci (Paris). 2008 Oct;24(10):841-6. doi: 10.1051/medsci/20082410841. Med Sci (Paris). 2008. PMID: 18950580 Review. French. - Role of ChREBP in hepatic steatosis and insulin resistance.
Denechaud PD, Dentin R, Girard J, Postic C. Denechaud PD, et al. FEBS Lett. 2008 Jan 9;582(1):68-73. doi: 10.1016/j.febslet.2007.07.084. Epub 2007 Aug 14. FEBS Lett. 2008. PMID: 17716660 Review.
Cited by
- The suppression of hepatic glucose production improves metabolism and insulin sensitivity in subcutaneous adipose tissue in mice.
Casteras S, Abdul-Wahed A, Soty M, Vulin F, Guillou H, Campana M, Le Stunff H, Pirola L, Rajas F, Mithieux G, Gautier-Stein A. Casteras S, et al. Diabetologia. 2016 Dec;59(12):2645-2653. doi: 10.1007/s00125-016-4097-y. Epub 2016 Sep 9. Diabetologia. 2016. PMID: 27631137 - Hepatic glucose sensing is required to preserve β cell glucose competence.
Seyer P, Vallois D, Poitry-Yamate C, Schütz F, Metref S, Tarussio D, Maechler P, Staels B, Lanz B, Grueter R, Decaris J, Turner S, da Costa A, Preitner F, Minehira K, Foretz M, Thorens B. Seyer P, et al. J Clin Invest. 2013 Apr;123(4):1662-76. doi: 10.1172/JCI65538. Epub 2013 Mar 15. J Clin Invest. 2013. PMID: 23549084 Free PMC article. - Hexokinase-linked glycolytic overload and unscheduled glycolysis in hyperglycemia-induced pathogenesis of insulin resistance, beta-cell glucotoxicity, and diabetic vascular complications.
Rabbani N, Thornalley PJ. Rabbani N, et al. Front Endocrinol (Lausanne). 2024 Jan 16;14:1268308. doi: 10.3389/fendo.2023.1268308. eCollection 2023. Front Endocrinol (Lausanne). 2024. PMID: 38292764 Free PMC article. - Regulation and Metabolic Significance of De Novo Lipogenesis in Adipose Tissues.
Song Z, Xiaoli AM, Yang F. Song Z, et al. Nutrients. 2018 Sep 29;10(10):1383. doi: 10.3390/nu10101383. Nutrients. 2018. PMID: 30274245 Free PMC article. Review. - Physiological Changes and Pathological Pain Associated with Sedentary Lifestyle-Induced Body Systems Fat Accumulation and Their Modulation by Physical Exercise.
Verdú E, Homs J, Boadas-Vaello P. Verdú E, et al. Int J Environ Res Public Health. 2021 Dec 17;18(24):13333. doi: 10.3390/ijerph182413333. Int J Environ Res Public Health. 2021. PMID: 34948944 Free PMC article. Review.
References
Publication types
MeSH terms
Substances
LinkOut - more resources
Full Text Sources
Other Literature Sources
Molecular Biology Databases
Miscellaneous


