Phylotype-level 16S rRNA analysis reveals new bacterial indicators of health state in acute murine colitis - PubMed (original) (raw)
. 2012 Nov;6(11):2091-106.
doi: 10.1038/ismej.2012.39. Epub 2012 May 10.
Clarissa Schwab, Gabriel Milinovich, Jochen Reichert, Karim Ben Mahfoudh, Thomas Decker, Marion Engel, Brigitte Hai, Eva Hainzl, Susanne Heider, Lukas Kenner, Mathias Müller, Isabella Rauch, Birgit Strobl, Michael Wagner, Christa Schleper, Tim Urich, Alexander Loy
Affiliations
- PMID: 22572638
- PMCID: PMC3475367
- DOI: 10.1038/ismej.2012.39
Phylotype-level 16S rRNA analysis reveals new bacterial indicators of health state in acute murine colitis
David Berry et al. ISME J. 2012 Nov.
Abstract
Human inflammatory bowel disease and experimental colitis models in mice are associated with shifts in intestinal microbiota composition, but it is unclear at what taxonomic/phylogenetic level such microbiota dynamics can be indicative for health or disease. Here, we report that dextran sodium sulfate (DSS)-induced colitis is accompanied by major shifts in the composition and function of the intestinal microbiota of STAT1(-/-) and wild-type mice, as determined by 454 pyrosequencing of bacterial 16S rRNA (gene) amplicons, metatranscriptomics and quantitative fluorescence in situ hybridization of selected phylotypes. The bacterial families Ruminococcaceae, Bacteroidaceae, Enterobacteriaceae, Deferribacteraceae and Verrucomicrobiaceae increased in relative abundance in DSS-treated mice. Comparative 16S rRNA sequence analysis at maximum possible phylogenetic resolution identified several indicator phylotypes for DSS treatment, including the putative mucin degraders Akkermansia and Mucispirillum. The analysis additionally revealed strongly contrasting abundance changes among phylotypes of the same family, particularly within the Lachnospiraceae. These extensive phylotype-level dynamics were hidden when reads were grouped at higher taxonomic levels. Metatranscriptomic analysis provided insights into functional shifts in the murine intestinal microbiota, with increased transcription of genes associated with regulation and cell signaling, carbohydrate metabolism and respiration and decreased transcription of flagellin genes during inflammation. These findings (i) establish the first in-depth inventory of the mouse gut microbiota and its metatranscriptome in the DSS colitis model, (ii) reveal that family-level microbial community analyses are insufficient to reveal important colitis-associated microbiota shifts and (iii) support a scenario of shifting intra-family structure and function in the phylotype-rich and phylogenetically diverse Lachnospiraceae in DSS-treated mice.
Figures
Figure 1
Effect of DSS treatment on weight loss, crypt damage and STAT1 phosphorylation in wt and STAT1−/− mice. (a) The body weight of each mouse is expressed as the percent of its weight at the start of the experiment. Weights for each mouse are presented for wt (black) and STAT1−/− (red) control (triangle) and DSS-treated (circle) mice. The arithmetic averages for replicates are plotted as solid lines for DSS-treated mice. (b) Pathology scoring of hematoxylin and eosin stained intestinal tissue from DSS-treated wt and STAT1−/− mice in a blinded evaluation according to the literature (Stevceva et al., 1999). (c) Representative staining for phosphorylated-STAT1 (pSTAT1) in intestinal tissue of a DSS-treated wt and STAT1−/− mouse. (d) Quantification of pSTAT1 in tissues of wt mice over the course of DSS treatment.
Figure 2
Pearson correlation coefficient of phylotype relative abundance between all phylotype pairs. The Pearson correlation coefficient was calculated for each pair of phylotypes by calculating the correlation of their relative abundances in all DNA-based intestinal lumen libraries. (a) The correlation coefficients are plotted against the sequence dissimilarity of the 16S rRNA genes being compared. (b) The arithmetic average correlation coefficient (including both positive and negative correlations) of phylotypes assigned to the same taxonomic family, which is a proxy for the amount of ecological cohesion within a family. Whiskers indicate s.e.m.
Figure 3
Dominant indicator phylotypes of health state and genotype. Dominant indicator phylotypes are presented with their relative abundance (as percent) in each sample of DNA- and RNA-based sequencing libraries. Each phylotype is annotated with the closest reference sequence from the Living Tree Project (Yarza et al., 2008), and information is in bold font when they share at least 97% sequence similarity. Dominant indicators are significantly associated with a specific condition and show >0.5% difference in relative abundance between two conditions (for details see Materials and Methods). The phylotypes are grouped and color coded according to the condition for which they are an indicator for each combination of treatment and genotype. Each column in the ‘DNA template' and ‘RNA template' blocks represents a sample from a single mouse. A representative sequence for each indicator phylotype is given in the supplement. Detailed information on sample numbers and sequencing depth is available in Supplementary Figure S3.
Figure 4
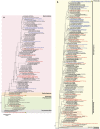
Phylogenetic tree of dominant indicator OTUs. Indicator phylotypes for DSS-treated (red) and control (blue) mice were added to a bootstrapped RAxML tree of full-length sequences via quick-add parsimony without modifying tree topology to demonstrate the approximate phylogenetic placement of indicators. The tree is expanded to show most phyla in (a) and the Firmicutes in (b). Living Tree Project reference sequences are indicated in bold font. Nodes with bootstrap support of at least 75% (○) and 90% (●) are marked and phylotypes that were quantified with FISH are indicated with a star.
Figure 5
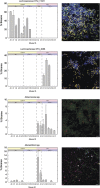
Quantitative FISH for selected indicator phylotypes. The relative abundance, represented as percent bacterial bio-area (the area of all microbes detected with the EUB338 probe set), of selected indicators is shown for each sample. Error bars indicate the s.d. from technical replication of target quantification. Samples are lumen biomass pooled from the cecum and colon. Each sample is shown to illustrate the significant inter-individual variability. Example images are shown for each probe. The specific probe is shown in yellow for Lachnospiraceae OTU_11021 and Lachnospiraceae OTU_9468, red for Akkermansia and purple for Mucispirillum. Other bacteria are shown in either blue or green. The white bar on each image indicates a length of 10 μm. No fluorescence was observed when samples were hybridized with the NONEUB probe (negative control) under these conditions.
Figure 6
Taxonomic composition of mRNA and rRNA reads from metatranscriptome libraries. Assignment of rRNA (left) and mRNA (right) on the ‘order' level was determined with MEGAN and the relative abundance of the major groups is presented as a color-coded stacked column graph for each of the pooled samples. Five replicate mice were pooled for all conditions except DSS-treated wt mice, which had two replicates. The abundance of reads that could not be classified is the difference between the total of each stacked column and 100%. The inset at the top of the figure is a magnification to more clearly show the change in relative abundance of less abundant groups. Con, control.
Similar articles
- Enteric Delivery of Regenerating Family Member 3 alpha Alters the Intestinal Microbiota and Controls Inflammation in Mice With Colitis.
Darnaud M, Dos Santos A, Gonzalez P, Augui S, Lacoste C, Desterke C, De Hertogh G, Valentino E, Braun E, Zheng J, Boisgard R, Neut C, Dubuquoy L, Chiappini F, Samuel D, Lepage P, Guerrieri F, Doré J, Bréchot C, Moniaux N, Faivre J. Darnaud M, et al. Gastroenterology. 2018 Mar;154(4):1009-1023.e14. doi: 10.1053/j.gastro.2017.11.003. Epub 2017 Nov 11. Gastroenterology. 2018. PMID: 29133078 - Initial gut microbiota structure affects sensitivity to DSS-induced colitis in a mouse model.
Li M, Wu Y, Hu Y, Zhao L, Zhang C. Li M, et al. Sci China Life Sci. 2018 Jul;61(7):762-769. doi: 10.1007/s11427-017-9097-0. Epub 2017 Aug 15. Sci China Life Sci. 2018. PMID: 28842897 - Acute dextran sulfate sodium (DSS)-induced colitis promotes gut microbial dysbiosis in mice.
Munyaka PM, Rabbi MF, Khafipour E, Ghia JE. Munyaka PM, et al. J Basic Microbiol. 2016 Sep;56(9):986-98. doi: 10.1002/jobm.201500726. Epub 2016 Apr 26. J Basic Microbiol. 2016. PMID: 27112251 - Recent advances in molecular approaches to gut microbiota in inflammatory bowel disease.
Andoh A, Benno Y, Kanauchi O, Fujiyama Y. Andoh A, et al. Curr Pharm Des. 2009;15(18):2066-73. doi: 10.2174/138161209788489186. Curr Pharm Des. 2009. PMID: 19519444 Review. - Application of phylogenetic microarrays to interrogation of human microbiota.
Paliy O, Agans R. Paliy O, et al. FEMS Microbiol Ecol. 2012 Jan;79(1):2-11. doi: 10.1111/j.1574-6941.2011.01222.x. Epub 2011 Nov 9. FEMS Microbiol Ecol. 2012. PMID: 22092522 Free PMC article. Review.
Cited by
- Effects of Pretreatment with Bifidobacterium bifidum Using 16S Ribosomal RNA Gene Sequencing in a Mouse Model of Acute Colitis Induced by Dextran Sulfate Sodium.
Weng YJ, Jiang DX, Liang J, Ye SC, Tan WK, Yu CY, Zhou Y. Weng YJ, et al. Med Sci Monit. 2021 Mar 9;27:e928478. doi: 10.12659/MSM.928478. Med Sci Monit. 2021. PMID: 33686049 Free PMC article. - Herbal Formula-3 ameliorates OVA-induced food allergy in mice may via modulating the gut microbiota.
Liu S, Yang B, Yang P, Liu Z. Liu S, et al. Am J Transl Res. 2019 Sep 15;11(9):5812-5823. eCollection 2019. Am J Transl Res. 2019. PMID: 31632550 Free PMC article. - Ameliorating Effects of Vitamin K2 on Dextran Sulfate Sodium-Induced Ulcerative Colitis in Mice.
Hu S, Ma Y, Xiong K, Wang Y, Liu Y, Sun Y, Yang Y, Ma A. Hu S, et al. Int J Mol Sci. 2023 Feb 3;24(3):2986. doi: 10.3390/ijms24032986. Int J Mol Sci. 2023. PMID: 36769323 Free PMC article. - Whole genome sequencing and function prediction of 133 gut anaerobes isolated from chicken caecum in pure cultures.
Medvecky M, Cejkova D, Polansky O, Karasova D, Kubasova T, Cizek A, Rychlik I. Medvecky M, et al. BMC Genomics. 2018 Jul 31;19(1):561. doi: 10.1186/s12864-018-4959-4. BMC Genomics. 2018. PMID: 30064352 Free PMC article. - The Microbiome and Gut Endocannabinoid System in the Regulation of Stress Responses and Metabolism.
Srivastava RK, Lutz B, Ruiz de Azua I. Srivastava RK, et al. Front Cell Neurosci. 2022 May 11;16:867267. doi: 10.3389/fncel.2022.867267. eCollection 2022. Front Cell Neurosci. 2022. PMID: 35634468 Free PMC article. Review.
References
- Achtman M, Wagner M. Microbial diversity and the genetic nature of microbial species. Nat Rev Microbiol. 2008;6:431–440. - PubMed
- Afkarian M, Sedy JR, Yang J, Jacobson NG, Cereb N, Yang SY, et al. T-bet is a STAT 1-induced regulator of IL-12 R expression in naive CD 4+ T cells. Nat Immunol. 2002;3:549–557. - PubMed
Publication types
MeSH terms
Substances
LinkOut - more resources
Full Text Sources
Other Literature Sources
Research Materials
Miscellaneous


