Disrupted autophagy leads to dopaminergic axon and dendrite degeneration and promotes presynaptic accumulation of α-synuclein and LRRK2 in the brain - PubMed (original) (raw)
Disrupted autophagy leads to dopaminergic axon and dendrite degeneration and promotes presynaptic accumulation of α-synuclein and LRRK2 in the brain
Lauren G Friedman et al. J Neurosci. 2012.
Abstract
Parkinson's disease (PD) is characterized pathologically by the formation of ubiquitin and α-synuclein (α-syn)-containing inclusions (Lewy bodies), dystrophic dopamine (DA) terminals, and degeneration of midbrain DA neurons. The precise molecular mechanisms underlying these pathological features remain elusive. Accumulating evidence has implicated dysfunctional autophagy, the cell self-digestion and neuroprotective pathway, as one of the pathogenic systems contributing to the development of idiopathic PD. Here we characterize autophagy-deficient mouse models and provide in vivo evidence for the potential role that impaired autophagy plays in pathogenesis associated with PD. Cell-specific deletion of essential autophagy gene Atg7 in midbrain DA neurons causes delayed neurodegeneration, accompanied by late-onset locomotor deficits. In contrast, Atg7-deficient DA neurons in the midbrain exhibit early dendritic and axonal dystrophy, reduced striatal dopamine content, and the formation of somatic and dendritic ubiquitinated inclusions in DA neurons. Furthermore, whole-brain-specific loss of Atg7 leads to presynaptic accumulation of α-syn and LRRK2 proteins, which are encoded by two autosomal dominantly inherited PD-related genes. Our results suggest that disrupted autophagy may be associated with enhanced levels of endogenous α-syn and LRRK2 proteins in vivo. Our findings implicate dysfunctional autophagy as one of the failing cellular mechanisms involved in the pathogenesis of idiopathic PD.
Figures
Figure 1.
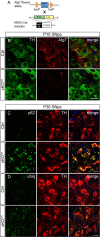
Generation of Atg7_fl/fl;TH-IRES-Cre_ mice. A, Schematic representation of genetic cross between mice carrying the floxed Atg7 allele and knock-in mice carrying IRES-Cre inserted at the 3′UTR of the TH gene to generate Atg7fl/fl;TH-IRES-Cre (cKOTH) mice. B, Immunofluorescence labeling of TH (green) or Atg7 (red) in the SNpc at P10. Atg7 immunoreactivity is reduced in TH+ neurons by P10 in cKOTH mice. C, D, Numerous p62 and ubiquitin inclusions form in TH+ cell bodies at P30. Confocal images show TH (red) and (C) p62/SQSTM1 (green) or (D) ubiquitin (green) immunostaining in the SNpc. DAPI nuclear staining shown in blue. Scale bars, 20 μm.
Figure 2.
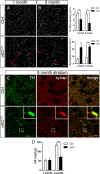
Delayed DA neuron cell death and locomotor impairment in cKOTH mice. The number of DA neurons in the SNpc was identified by TH immunoreactivity and cresyl violet stained nuclei at (A) 4 months (n = 4 per group) and (B) 9 months (n = 4 per group). Stereological analysis of TH-labeled neurons shown to the right. C, D, Locomotor activity of cKOTH mice at 4 and 9 months in an automated open-field. C, Horizontal and D, vertical activity was measured by the number of beam breaks over 30 min in 4-month-old (n = 7 per group) and 9-month-old mice (n = 7–8 per group). E, The number of errors per step was recorded as 4-month-old (n = 6 per group) and 9-month-old (n = 7–8 per group) mice cross the challenging beam. The data represent the average error rate over 5 trials. *p < 0.05, **p < 0.01, ***p < 0.001.
Figure 3.
DAergic axon terminal degeneration and disrupted DA homeostasis. A, B, High resolution confocal images through the dorsolateral striatum show TH immunoreactivity. Images from (A) 1-month-old (n = 3–5 per group) and (B) 9-month-old mice (n = 3–4 per group) were deconvolved. Arrows indicate axon swellings in cKOTH striatum. Scale bar: (in B) A, B, 5 μm. TH+ fiber density and dystrophic axons, defined as puncta ≥0.6 μm2, were quantified. C, High resolution confocal images through the dorsolateral striatum show immunofluorescence labeling of TH (green) and synaptophysin (red), where yellow indicates DAergic axon terminals. High magnification of a dystrophic axon is shown in the inset. Scale bars: C, 10 μm; inset, 1.5 μm. D, HPLC analysis of DA levels in the dorsal striatum at 1 month (n = 6–7 per group) and 4 months (n = 5–6 per group). *p < 0.05, ***p < 0.001.
Figure 4.
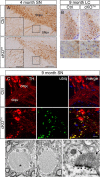
Dendritic dystrophy associated with ubiquitinated aggregate accumulation. A, Immunostaining with TH in midbrain DA neurons of cKOTH mice at 4 months. High-magnification images are shown in inset. SNpc, substantia nigra pars compacta, SNpr, substantia nigra pars reticulata. Scale bars: A, 150 μm; inset, 50 μm. B, Immunohistochemical staining with TH in noradrenergic neurons of the locus ceruleus in cKOTH mice at 9 months reveals dendritic swellings and degeneration. Cresyl violet staining labels nuclei. High-magnification images of noradrenergic dendrites are below. Scale bars: B, 50 μm; magnified image, 20 μm. C, High resolution confocal images through the midbrain at 9 months with ubiquitin (green) and TH (red). Scale bar: 20 μm. D–F, Representative electron micrographs of dendrites in the substantia nigra of cKOTH mice at 9 months. D, Large filamentous inclusion, as indicated by asterisk, within a swollen dendrite. E, Synapses adjacent to large inclusions remain morphologically intact (boxed area). F, High-magnification image of synapse (boxed area in E). Arrowheads indicate normal postsynaptic densities and arrows point to normal presynaptic vesicle pool. Scale bars: D, E, 1 μm; F, 250 nm.
Figure 5.
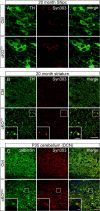
Abnormal presynaptic accumulation of α-syn protein in cKOTH and cKONes mice brain. A, Immunofluorescence labeling with TH (green) and Syn303 (red) in cKOTH mice at 20 months shows no difference in α-syn expression in DAergic cell bodies of the SNpc. B, Confocal images through the dorsal striatum of 20-month-old cKOTH mice with TH (green) and Syn303 (red). High magnification of swollen TH+ axon terminals containing Syn303 deposits shown in inset. Scale bars: A, B, 20 μm; B, inset, 5 μm. C, Immunofluorescence labeling of Syn303 (red) and calbindin (green) in Purkinje cell axons in the DCN of cKONes mice at P35. DAPI nuclear staining shown in blue. Scale bars: C, 25 μm; inset, 5 μm.
Figure 6.
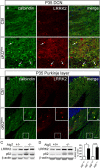
Elevated LRRK2 levels in autophagy deficient neurons and cell lines. Immunofluorescence staining of LRRK2 (red) and calbindin (green) in (A) Purkinje cell axons and (B) Purkinje cell dendrites in cKONes mice at P35. Inset shows magnified image of boxed areas. Scale bars: A, B, 50 μm; B, inset, 10 μm. C, Representative Western blot of endogenous LRRK2 in Atg7 heterozygous (+/−) and Atg7 KO (−/−) or (D) Atg5 wild-type (+/+) and Atg5 KO (−/−) MEF cells. Densitometric quantification shown on the right (n = 5 per group). *p < 0.05, ***p < 0.001.
Comment in
- Neuronal autophagy, α-synuclein clearance, and LRRK2 regulation: a lost equilibrium in parkinsonian brain.
Plotegher N, Civiero L. Plotegher N, et al. J Neurosci. 2012 Oct 24;32(43):14851-3. doi: 10.1523/JNEUROSCI.3588-12.2012. J Neurosci. 2012. PMID: 23100407 Free PMC article. No abstract available.
Similar articles
- VPS35 in Dopamine Neurons Is Required for Endosome-to-Golgi Retrieval of Lamp2a, a Receptor of Chaperone-Mediated Autophagy That Is Critical for α-Synuclein Degradation and Prevention of Pathogenesis of Parkinson's Disease.
Tang FL, Erion JR, Tian Y, Liu W, Yin DM, Ye J, Tang B, Mei L, Xiong WC. Tang FL, et al. J Neurosci. 2015 Jul 22;35(29):10613-28. doi: 10.1523/JNEUROSCI.0042-15.2015. J Neurosci. 2015. PMID: 26203154 Free PMC article. - Progressive nigrostriatal terminal dysfunction and degeneration in the engrailed1 heterozygous mouse model of Parkinson's disease.
Nordströma U, Beauvais G, Ghosh A, Pulikkaparambil Sasidharan BC, Lundblad M, Fuchs J, Joshi RL, Lipton JW, Roholt A, Medicetty S, Feinstein TN, Steiner JA, Escobar Galvis ML, Prochiantz A, Brundin P. Nordströma U, et al. Neurobiol Dis. 2015 Jan;73:70-82. doi: 10.1016/j.nbd.2014.09.012. Epub 2014 Oct 2. Neurobiol Dis. 2015. PMID: 25281317 Free PMC article. - Progressive neurodegenerative and behavioural changes induced by AAV-mediated overexpression of α-synuclein in midbrain dopamine neurons.
Decressac M, Mattsson B, Lundblad M, Weikop P, Björklund A. Decressac M, et al. Neurobiol Dis. 2012 Mar;45(3):939-53. doi: 10.1016/j.nbd.2011.12.013. Epub 2011 Dec 11. Neurobiol Dis. 2012. PMID: 22182688 - Reprint of: revisiting oxidative stress and mitochondrial dysfunction in the pathogenesis of Parkinson disease-resemblance to the effect of amphetamine drugs of abuse.
Perfeito R, Cunha-Oliveira T, Rego AC. Perfeito R, et al. Free Radic Biol Med. 2013 Sep;62:186-201. doi: 10.1016/j.freeradbiomed.2013.05.042. Epub 2013 Jun 3. Free Radic Biol Med. 2013. PMID: 23743292 Review. - Evidence for dopaminergic axonal degeneration as an early pathological process in Parkinson's disease.
O'Keeffe GW, Sullivan AM. O'Keeffe GW, et al. Parkinsonism Relat Disord. 2018 Nov;56:9-15. doi: 10.1016/j.parkreldis.2018.06.025. Epub 2018 Jun 19. Parkinsonism Relat Disord. 2018. PMID: 29934196 Review.
Cited by
- Genetic perspective on the role of the autophagy-lysosome pathway in Parkinson disease.
Gan-Or Z, Dion PA, Rouleau GA. Gan-Or Z, et al. Autophagy. 2015;11(9):1443-57. doi: 10.1080/15548627.2015.1067364. Autophagy. 2015. PMID: 26207393 Free PMC article. Review. - Molecular Mechanism and Regulation of Autophagy and Its Potential Role in Epilepsy.
Zhu H, Wang W, Li Y. Zhu H, et al. Cells. 2022 Aug 23;11(17):2621. doi: 10.3390/cells11172621. Cells. 2022. PMID: 36078029 Free PMC article. Review. - Filamentous Aggregation of Sequestosome-1/p62 in Brain Neurons and Neuroepithelial Cells upon Tyr-Cre-Mediated Deletion of the Autophagy Gene Atg7.
Sukseree S, László L, Gruber F, Bergmann S, Narzt MS, Nagelreiter IM, Höftberger R, Molnár K, Rauter G, Birngruber T, Larue L, Kovacs GG, Tschachler E, Eckhart L. Sukseree S, et al. Mol Neurobiol. 2018 Nov;55(11):8425-8437. doi: 10.1007/s12035-018-0996-x. Epub 2018 Mar 17. Mol Neurobiol. 2018. PMID: 29550918 Free PMC article. - ERKed by LRRK2: a cell biological perspective on hereditary and sporadic Parkinson's disease.
Verma M, Steer EK, Chu CT. Verma M, et al. Biochim Biophys Acta. 2014 Aug;1842(8):1273-81. doi: 10.1016/j.bbadis.2013.11.005. Epub 2013 Nov 10. Biochim Biophys Acta. 2014. PMID: 24225420 Free PMC article. Review. - Exploring the Role of Autophagy Dysfunction in Neurodegenerative Disorders.
Rana T, Behl T, Sehgal A, Mehta V, Singh S, Bhatia S, Al-Harrasi A, Bungau S. Rana T, et al. Mol Neurobiol. 2021 Oct;58(10):4886-4905. doi: 10.1007/s12035-021-02472-0. Epub 2021 Jul 2. Mol Neurobiol. 2021. PMID: 34212304 Review.
References
- Bywood PT, Johnson SM. Dendrite loss is a characteristic early indicator of toxin-induced neurodegeneration in rat midbrain slices. Exp Neurol. 2000;161:306–316. - PubMed
- Cuervo AM, Stefanis L, Fredenburg R, Lansbury PT, Sulzer D. Impaired degradation of mutant alpha-synuclein by chaperone-mediated autophagy. Science. 2004;305:1292–1295. - PubMed
- Dauer W, Przedborski S. Parkinson's disease: mechanisms and models. Neuron. 2003;39:889–909. - PubMed
- Duda JE, Giasson BI, Mabon ME, Lee VM, Trojanowski JQ. Novel antibodies to synuclein show abundant striatal pathology in Lewy body diseases. Ann Neurol. 2002;52:205–210. - PubMed
Publication types
MeSH terms
Substances
Grants and funding
- RNS055683A/PHS HHS/United States
- 5R24 CA095823-04/CA/NCI NIH HHS/United States
- R01NS060123/NS/NINDS NIH HHS/United States
- R01 NS072359/NS/NINDS NIH HHS/United States
- R01 NS060809/NS/NINDS NIH HHS/United States
- 1 S10 RR0 9145-01./RR/NCRR NIH HHS/United States
- R21 NS055683/NS/NINDS NIH HHS/United States
- R24 CA095823/CA/NCI NIH HHS/United States
- NS060809/NS/NINDS NIH HHS/United States
- R01 NS060123/NS/NINDS NIH HHS/United States
- T32 MH096678/MH/NIMH NIH HHS/United States
LinkOut - more resources
Full Text Sources
Molecular Biology Databases
Miscellaneous
