ANKRD26 and its interacting partners TRIO, GPS2, HMMR and DIPA regulate adipogenesis in 3T3-L1 cells - PubMed (original) (raw)
ANKRD26 and its interacting partners TRIO, GPS2, HMMR and DIPA regulate adipogenesis in 3T3-L1 cells
Xiu-Fen Liu et al. PLoS One. 2012.
Abstract
Partial inactivation of the Ankyrin repeat domain 26 (Ankrd26) gene causes obesity and diabetes in mice and increases spontaneous and induced adipogenesis in mouse embryonic fibroblasts. However, it is not yet known how the Ankrd26 protein carries out its biological functions. We identified by yeast two-hybrid and immunoprecipitation assays the triple functional domain protein (TRIO), the G protein pathway suppressor 2 (GPS2), the delta-interacting protein A (DIPA) and the hyaluronan-mediated motility receptor (HMMR) as ANKRD26 interacting partners. Adipogenesis of 3T3-L1 cells was increased by selective down-regulation of Ankrd26, Trio, Gps2, Hmmr and Dipa. Furthermore, GPS2 and DIPA, which are normally located in the nucleus, were translocated to the cytoplasm, when the C-terminus of ANKRD26 was introduced into these cells. These findings provide biochemical evidence that ANKRD26, TRIO, GPS2 and HMMR are novel and important regulators of adipogenesis and identify new targets for the modulation of adipogenesis.
Conflict of interest statement
Competing Interests: The authors have declared that no competing interests exist.
Figures
Figure 1. ANKRD26 yeast two-hybrid strategy.
The position of ANKRD26's ankyrin and spectrin coiled-coil repeats are depicted on a schematic diagram of the full-length, 1710 amino acid, protein. The line below indicates the relative locations of ANKRD26 bait clones used in the _GAL4-_based yeast two-hybrid cDNA library screens. DIPA interacts with baits 7, 8, 9 and 17; GPS2 interacts with bait 17; HMMR interacts with baits 9 and 17; and TRIO interacts with bait 10.
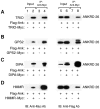
Figure 2. Protein interactions of ANKRD26 with TRIO, GPS2, DIPA and HMMR.
A) Immunoblot of whole cell lysates (input; lanes 1–2 and 5–6) and IP (lanes 3–4 and 7–8) from 293/T cells over-expressing Flag-ANKRD26-C (lanes 1–8) and TRIO-Myc (lanes 2, 4, 6 and 8). B) Immunoblot of whole cell lysates (input; lanes 1–2 and 5–6) and IP (lanes 3–4 and 7–8) from 293/T cells over-expressing Flag-ANKRD26-C (lanes 1–8) and GPS2-Myc (lanes 2, 4, 6 and 8). C) Immunoblot of whole cell lysates (input; lanes 1–2 and 5–6) and IP (lanes 3–4 and 7–8) from 293/T cells over-expressing Flag-ANKRD26-C (lanes 1–8) and DIPA-Myc (lanes 2, 4, 6 and 8). D) Immunoblot of whole cell lysates (input; lanes 1–2 and 5–6) and IP (lanes 3–4 and 7–8) from 293/T cells over-expressing Flag-ANKRD26-C (lanes 1–8) and HMMR-Myc (lanes 2, 4, 6 and 8). IP were performed using the anti-Myc antibody as described in Methods. Left blots were probed with anti-Myc antibody, while right blots were striped and then probed with anti-Flag antibody.
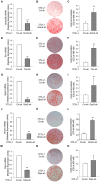
Figure 3. shRNA knockdown of Ankrd26, Trio, Gps2, HMMR and Dipa induces adipocyte differentiation in 3T3-L1 cells.
To down-regulate Ankrd26, Trio, Gps2, HMMR and Dipa expression cells were transfected with specific shRNA for Ankrd26 (Ankrd-sh), Trio (Trio-sh), Gps2 (Gps2-sh), HMMR (HMMR-sh), Dipa (Dipa-sh) or with non-targeting control shRNA (Co-sh). A) Ankrd26 mRNA expression determined by Real-Time Quantitative PCR analysis of total RNA isolated from 3T3-L1 cells transfected with Ankrd-sh or Co-sh. mRNA levels in Ankrd-sh treated cells are relative expression units to those in control (Co-sh; mean ± SD; n = 3). **p<0.01. Macroscopic images (B) and lipid quantification (C) in Ankrd-sh and Co-sh transfected cells stained with oil-red-O upon differentiation. Bars are expressed as means ± SEM of oil-red-O values measured at 490 nm. Ankrd-sh vs. Co-sh, **p<0.01. mRNA expression (D, G, J and M), macroscopic images (E, H, K and N) and lipid quantification (F, I, L and O) of 3T3-L1 cells transduced with Trio-sh (D–F), Gps2-sh (G–I), HMMR-sh (J–L) and Dipa-sh (M–O) were evaluated as A, B and C, respectively.
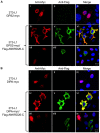
Figure 4. Nuclear localization of GPS2 and DIPA is affected in 3T3-L1 cells over-expressing Flag-ANKRD26-C.
A) 3T3-L1 cells transfected with GPS2-Myc (i–ix) and Flag-ANKRD26-C vectors (iv–ix) were double stained with antibodies against anti-Myc (i, iv, vii) and anti-Flag (ii, v, viii) and with DAPI solution for the nucleus staining (iii, vi, ix). B) 3T3-L1 cells transfected with DIPA-myc (i–ix) and Flag-ANKRD26-C vectors (iv–ix) were stained as in B. The images labeled iii, vi and ix are the merged fluorescent images. Note that only co-transfected cells in Panels vii, viii and ix demonstrate cytosolic localization on GPS2 and DIPA.
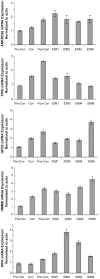
Figure 5. Analysis of Ankrd26, Trio, Gps2, HMMR and Dipa RNA by rq-pcr during adipogenesis induction.
3T3-L1 cells plated 6-well plates (1.8×10⁵/well) and harvested at various time points as: day 1 (pre-confluence), day 2 (confluence), day 4 (2 days after confluence), day 5 (IDM induction day 1), day 6 (IDM induction day 2), day 8 (IDM induction day 4), day12 (IDM induction day 8). RNA made by Trizol regent and subjected to Real Time Quantitative PCR using SYBR method. Bar represents triple for each sample.
Similar articles
- G-protein pathway suppressor 2 (GPS2) interacts with the regulatory factor X4 variant 3 (RFX4_v3) and functions as a transcriptional co-activator.
Zhang D, Harry GJ, Blackshear PJ, Zeldin DC. Zhang D, et al. J Biol Chem. 2008 Mar 28;283(13):8580-90. doi: 10.1074/jbc.M708209200. Epub 2008 Jan 24. J Biol Chem. 2008. PMID: 18218630 Free PMC article. - Loss of G protein pathway suppressor 2 in human adipocytes triggers lipid remodeling by upregulating ATP binding cassette subfamily G member 1.
Barilla S, Liang N, Mileti E, Ballaire R, Lhomme M, Ponnaiah M, Lemoine S, Soprani A, Gautier JF, Amri EZ, Le Goff W, Venteclef N, Treuter E. Barilla S, et al. Mol Metab. 2020 Dec;42:101066. doi: 10.1016/j.molmet.2020.101066. Epub 2020 Aug 13. Mol Metab. 2020. PMID: 32798719 Free PMC article. - Ankrd26 gene disruption enhances adipogenesis of mouse embryonic fibroblasts.
Fei Z, Bera TK, Liu X, Xiang L, Pastan I. Fei Z, et al. J Biol Chem. 2011 Aug 5;286(31):27761-8. doi: 10.1074/jbc.M111.248435. Epub 2011 Jun 13. J Biol Chem. 2011. PMID: 21669876 Free PMC article. - Hyaluronan Mediated Motility Receptor (HMMR) Encodes an Evolutionarily Conserved Homeostasis, Mitosis, and Meiosis Regulator Rather than a Hyaluronan Receptor.
He Z, Mei L, Connell M, Maxwell CA. He Z, et al. Cells. 2020 Mar 28;9(4):819. doi: 10.3390/cells9040819. Cells. 2020. PMID: 32231069 Free PMC article. Review. - The Trio family of guanine-nucleotide-exchange factors: regulators of axon guidance.
Bateman J, Van Vactor D. Bateman J, et al. J Cell Sci. 2001 Jun;114(Pt 11):1973-80. doi: 10.1242/jcs.114.11.1973. J Cell Sci. 2001. PMID: 11493634 Review.
Cited by
- GATA binding protein 2 mediated ankyrin repeat domain containing 26 high expression in myeloid-derived cell lines.
Jiang YZ, Hu LY, Chen MS, Wang XJ, Tan CN, Xue PP, Yu T, He XY, Xiang LX, Xiao YN, Li XL, Ran Q, Li ZJ, Chen L. Jiang YZ, et al. World J Stem Cells. 2024 May 26;16(5):538-550. doi: 10.4252/wjsc.v16.i5.538. World J Stem Cells. 2024. PMID: 38817334 Free PMC article. - POTEE promotes breast cancer cell malignancy by inducing invadopodia formation through the activation of SUMOylated Rac1.
Martínez-López A, García-Casas A, Infante G, González-Fernández M, Salvador N, Lorente M, Mendiburu-Eliçabe M, Gonzalez-Moreno S, Villarejo-Campos P, Velasco G, Malliri A, Castillo-Lluva S. Martínez-López A, et al. Mol Oncol. 2024 Mar;18(3):620-640. doi: 10.1002/1878-0261.13568. Epub 2023 Dec 27. Mol Oncol. 2024. PMID: 38098337 Free PMC article. - Identification of early diagnostic biomarkers for breast cancer through bioinformatics analysis.
Yan S, Yue S. Yan S, et al. Medicine (Baltimore). 2023 Sep 15;102(37):e35273. doi: 10.1097/MD.0000000000035273. Medicine (Baltimore). 2023. PMID: 37713876 Free PMC article. - ANKRD26 is a new regulator of type I cytokine receptor signaling in normal and pathological hematopoiesis.
Basso-Valentina F, Donada A, Manchev VT, Lisetto M, Balayn N, Martin JE, Muller D, Oyarzun CPM, Duparc H, Arkoun B, Cumin A, Faivre L, Droin N, Biunno I, Pecci A, Balduini A, Debili N, Antony-Debré I, Marty C, Vainchenker W, Plo I, Favier R, Raslova H. Basso-Valentina F, et al. Haematologica. 2023 Aug 1;108(8):2130-2145. doi: 10.3324/haematol.2022.282049. Haematologica. 2023. PMID: 36794499 Free PMC article. - Visceral Adipose Tissue Molecular Networks and Regulatory microRNA in Pediatric Obesity: An In Silico Approach.
Roy D, Modi A, Ghosh R, Ghosh R, Benito-León J. Roy D, et al. Int J Mol Sci. 2022 Sep 20;23(19):11036. doi: 10.3390/ijms231911036. Int J Mol Sci. 2022. PMID: 36232337 Free PMC article.
References
- Zimmet P, Alberti KG, Shaw J. Global and societal implications of the diabetes epidemic. Nature. 2001;414:782–787. - PubMed
- Walder K, Segal D, Jowett J, Blangero J, Collier GR. Obesity and diabetes gene discovery approaches. Curr Pharm Des. 2003;9:1357–1372. - PubMed
- Haslam DW, James WP. Obesity. Lancet. 2005;366:1197–1209. - PubMed
- Frayling TM. Genome-wide association studies provide new insights into type 2 diabetes aetiology. Nat Rev Genet. 2007;8:657–662. - PubMed
Publication types
MeSH terms
Substances
LinkOut - more resources
Full Text Sources
Other Literature Sources
Molecular Biology Databases


