A miR-19 regulon that controls NF-κB signaling - PubMed (original) (raw)
. 2012 Sep;40(16):8048-58.
doi: 10.1093/nar/gks521. Epub 2012 Jun 7.
H James Stunden, Claire E McCoy, Mark A Behlke, Die Wang, Maria Kaparakis-Liaskos, Soroush T Sarvestani, Yuan H Yang, Dakang Xu, Sinéad C Corr, Eric F Morand, Bryan R G Williams
Affiliations
- PMID: 22684508
- PMCID: PMC3439911
- DOI: 10.1093/nar/gks521
A miR-19 regulon that controls NF-κB signaling
Michael P Gantier et al. Nucleic Acids Res. 2012 Sep.
Abstract
Fine-tuning of inflammatory responses by microRNAs (miRNAs) is complex, as they can both enhance and repress expression of pro-inflammatory mediators. In this study, we investigate inflammatory responses following global miRNA depletion, to better define the overall contribution of miRNAs to inflammation. We demonstrate that miRNAs positively regulate Toll-like receptor signaling using inducible Dicer1 deletion and global miRNA depletion. We establish an important contribution of miR-19b in this effect, which potentiates nuclear factor-κB (NF-κB) activity in human and mouse cells. Positive regulation of NF-κB signaling by miR-19b involves the coordinated suppression of a regulon of negative regulators of NF-κB signaling (including A20/Tnfaip3, Rnf11, Fbxl11/Kdm2a and Zbtb16). Transfection of miR-19b mimics exacerbated the inflammatory activation of rheumatoid arthritis primary fibroblast-like synoviocytes, demonstrating its physiological importance in the pathology of this disease. This study constitutes, to our knowledge, the first description of a miR-19 regulon that controls NF-κB signaling, and suggests that targeting this miRNA and linked family members could regulate the activity of NF-κB signaling in inflammation.
Figures
Figure 1.
Global depletion of miRNAs results in decreased pro-inflammatory cytokine production. (A–C) BMDMs from Dicer1flox/floxxCre/Esr1+ mice were treated (black bars) or untreated (white bars) for 48 h with 500 nM OHT as described in the ‘Materials and Methods’. (A) The cells were treated with 10 ng/ml Pam3CSK4 (TLR1/2 agonist), 10 ng/ml LPS (TLR4 agonist) or 1 μM CpG oligonucleotides (TLR9 agonist) 5 days after initial OHT treatment. IL-6, TNF-α and IL-12 levels were measured in supernatants collected 6 h after TLR stimulation. Data are averaged from two (Pam3CSK4 and CpG conditions) and three (LPS condition) independent experiments in biological triplicate. Two-tailed _t_-tests are shown (*P < 0.05, **P < 0.01 and ***P < 0.001). (B, C) Total RNA was extracted from non-stimulated cells and miR-19 b/let-7i (B) and Dicer1 mRNA levels (C) were measured by RT-qPCR. Expression was normalized to U6 RNA (B) and Gapdh mRNA (C) and is shown relative to non-OHT treated condition. Data are averaged from three independent experiments. (A–C) SEM is shown.
Figure 2.
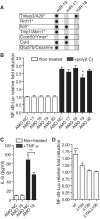
miR-19b is involved in the regulation of NF-κB signaling. (A) Targetscan (v6) (22) predictions of miR-17/20, miR-19 and miR-18 conserved targeting of known negative regulators of NF-κB signaling (5). The star denotes proteins proposed to belong to the A20 ubiquitin-editing complex (5). (B) HEK293 cells stably expressing TLR3 were transfected with an NF-κB-luciferase reporter, and 10 nM of the indicated antagomiR (AMO; AMO NC: non-target control). Cells were stimulated for 6 h with 10 μg/ml of poly(I:C) (black bars). Ratios of firefly luciferase/Renilla luciferase levels in lysates were reported to ratios of non-treated condition for each AMO. The data are averaged from three independent experiments in biological triplicate. (C) HEK293T cells were stimulated for 6 h with 10 ng/ml TNF-α (black bars) following transfection with 10 nM of the indicated AMO. Supernatants were collected and IL-8 levels measured by ELISA. The data are averaged from two independent experiments in biological triplicate. (B, C) Non-parametric Mann–Whitney U tests comparing AMO NC to AMO 19 condition are shown (*P < 0.05 and **P < 0.01). (D) HeLa cells were co-transfected with pN2-miR-17–19 b vectors and an NF-κB-/Renilla luciferase vector and cultured for 48 h. Ratios of firefly luciferase/Renilla luciferase levels in lysates were reported to ratios of Δ19aΔ19b vector condition (see ‘Materials and Methods’ section). Data shown are averaged from three independent experiments in biological triplicate with non-parametric Mann–Whitney U tests compared to Δ19aΔ19b vector condition (*P < 0.05 and ***P < 0.001). (B–D) SEM is shown.
Figure 3.
miR-19b is a critical component of the positive regulation of NF-κB signaling by miRNAs. (A) SV40-MEFs were transfected with an NF-κB-luciferase reporter, and 10 nM of the indicated AMO (AMO NC: non-target control). The cells were treated with 10 ng/ml Pam3CSK4 for 6 h. Cell lysates and supernatants were analyzed for NF-κB-luciferase activity (left) and IL-6 production (right), respectively. Ratios of firefly luciferase/Renilla luciferase levels in lysates were reported to ratios of non-treated condition for each AMO (left). The data are averaged from two independent experiments in biological triplicate. Two-tailed _t_-tests are shown (*P < 0.05). (B, C) Dicer1flox/floxxCre/Esr1+ and Dicer1flox/wtxCre/Esr1+ (B only) SV40-MEFs were treated (black bars) or untreated (white bars) for 16 h with 500 nM OHT, and expanded for a total of 4 days before stimulation with 10 ng/ml Pam3CSK4 (see ‘Materials and Methods’ section). IL-6 levels were measured 6 h after stimulation by ELISA. (B) Data shown are averaged from three independent experiments in biological triplicate, and fold repression of IL-6 production upon OHT treatment is indicated for each cell line. (C) Cells were transfected with 10 nM of indicated si-miRNA (si-C is siRNA control) on day 3 post-OHT treatment, and left for 16 h before Lipid A stimulation at 200 ng/ml. IL-6 levels were measured 6 h after stimulation by ELISA. The data are averaged from three independent experiments in biological triplicate with non-parametric Mann–Whitney U tests shown (*P < 0.05 and **P < 0.01). (A–C) SEM is shown.
Figure 4.
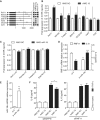
miR-19b controls several negative regulators of NF-κB signaling. (A) Schematic representation of the first 2000 nt of the 3′UTR from seven known regulators of NF-κB signaling (5,27–29). miR-19 predicted conserved target sites are indicated in grey along the murine 3′UTRs, using several prediction algorithms (22,30,31). (B, C) HEK293T cells transiently expressing each individual pRL-3′UTR Renilla reporter (B) or pRL-3′UTR-Δ19 mutated variants (C) were transfected with 10 nM of AMO NC or AMO 19 for 20 h. Ratios of Renilla luciferase/firefly luciferase levels in lysates were reported to ratios of AMO condition for each 3′UTR reporter. Data are averaged from three independent experiments in biological triplicate with non-parametric Mann–Whitney U tests compared to AMO conditions (*P < 0.05, **P < 0.01 and ***P < 0.001). (D, E) HeLa cells were transfected with 10 nM of si-miR-19b mimic or control siRNA (si-C) and incubated for 48 h. Total RNA was extracted from lysates and RNF11 mRNA (D) and miR-19b (E) levels measured by RT-qPCR, while supernatants were collected and IL-8 levels measured (D). Expression was normalized to GAPDH mRNA (D) and U6 RNA (E) and is shown relative to si-C condition. Data are averaged from three independent experiments in biological duplicate (RNF11 mRNA and miR-19b levels) or triplicate (IL-8 levels) with non-parametric Mann–Whitney U tests compared to si-C conditions (**P < 0.01 and ***P < 0.001). (F) HEK293T transfected with 10 nM of siEGFPN (left) or siRNF11 (right) for 24 h were transfected a second time with 10 nM of the indicated AMO for another 14 h. Supernatants were subsequently collected after 6 h of TNF-α stimulation at 20 ng/ml (black bars). Data are averaged from three independent experiments in biological triplicate and two-tailed _t_-test is shown (*P < 0.05). (B–F) SEM is shown.
Figure 5.
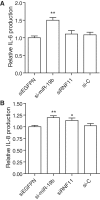
miR-19b transfection increases inflammation in primary human synovial fibroblasts. RA primary FLS were transfected with 10 nM of indicated RNA duplex (siEGFPN is used as control for siRNF11, both being Dicer substrates; see ‘Materials and Methods’ section), and incubated for 15 h. Supernatants were collected and assayed for IL-6 (A) and IL-8 (B) levels. Cytokine levels were normalized to that of siEGFPN condition to remove variations between independent experiments. The data are averaged from two independent experiments in biological triplicate, with Mann–Whitney U tests compared to siEGFPN condition (*P < 0.05 and **P < 0.01). (A–B) SEM is shown.
Similar articles
- Tumor necrosis factor α-induced microRNA-18a activates rheumatoid arthritis synovial fibroblasts through a feedback loop in NF-κB signaling.
Trenkmann M, Brock M, Gay RE, Michel BA, Gay S, Huber LC. Trenkmann M, et al. Arthritis Rheum. 2013 Apr;65(4):916-27. doi: 10.1002/art.37834. Arthritis Rheum. 2013. PMID: 23280137 - MiR-221 activates the NF-κB pathway by targeting A20.
Zhao D, Zhuang N, Ding Y, Kang Y, Shi L. Zhao D, et al. Biochem Biophys Res Commun. 2016 Mar 25;472(1):11-8. doi: 10.1016/j.bbrc.2015.11.009. Epub 2015 Nov 6. Biochem Biophys Res Commun. 2016. PMID: 26549234 - Down-regulation of microRNA-142-3p inhibits the aggressive phenotypes of rheumatoid arthritis fibroblast-like synoviocytes through inhibiting nuclear factor-κB signaling.
Qiang J, Lv T, Wu Z, Yang X. Qiang J, et al. Biosci Rep. 2019 Jul 8;39(7):BSR20190700. doi: 10.1042/BSR20190700. Print 2019 Jul 31. Biosci Rep. 2019. PMID: 31239367 Free PMC article. Retracted. - Regulation of the MIR155 host gene in physiological and pathological processes.
Elton TS, Selemon H, Elton SM, Parinandi NL. Elton TS, et al. Gene. 2013 Dec 10;532(1):1-12. doi: 10.1016/j.gene.2012.12.009. Epub 2012 Dec 14. Gene. 2013. PMID: 23246696 Review. - MicroRNAs in NF-kappaB signaling.
Ma X, Becker Buscaglia LE, Barker JR, Li Y. Ma X, et al. J Mol Cell Biol. 2011 Jun;3(3):159-66. doi: 10.1093/jmcb/mjr007. Epub 2011 Apr 18. J Mol Cell Biol. 2011. PMID: 21502305 Free PMC article. Review.
Cited by
- A multi-targeted approach to suppress tumor-promoting inflammation.
Samadi AK, Bilsland A, Georgakilas AG, Amedei A, Amin A, Bishayee A, Azmi AS, Lokeshwar BL, Grue B, Panis C, Boosani CS, Poudyal D, Stafforini DM, Bhakta D, Niccolai E, Guha G, Vasantha Rupasinghe HP, Fujii H, Honoki K, Mehta K, Aquilano K, Lowe L, Hofseth LJ, Ricciardiello L, Ciriolo MR, Singh N, Whelan RL, Chaturvedi R, Ashraf SS, Shantha Kumara HMC, Nowsheen S, Mohammed SI, Keith WN, Helferich WG, Yang X. Samadi AK, et al. Semin Cancer Biol. 2015 Dec;35 Suppl:S151-S184. doi: 10.1016/j.semcancer.2015.03.006. Epub 2015 May 5. Semin Cancer Biol. 2015. PMID: 25951989 Free PMC article. Review. - Carotid Disease and Ageing: A Literature Review on the Pathogenesis of Vascular Senescence in Older Subjects.
Sertedaki E, Veroutis D, Zagouri F, Galyfos G, Filis K, Papalambros A, Aggeli K, Tsioli P, Charalambous G, Zografos G, Sigala F. Sertedaki E, et al. Curr Gerontol Geriatr Res. 2020 Jun 13;2020:8601762. doi: 10.1155/2020/8601762. eCollection 2020. Curr Gerontol Geriatr Res. 2020. PMID: 32582337 Free PMC article. Review. - MiR-19 Family Impairs Adipogenesis by the Downregulation of the PPARγ Transcriptional Network.
Juiz-Valiña P, Varela-Rodríguez BM, Outeiriño-Blanco E, García-Brao MJ, Mena E, Cordido F, Sangiao-Alvarellos S. Juiz-Valiña P, et al. Int J Mol Sci. 2022 Dec 13;23(24):15792. doi: 10.3390/ijms232415792. Int J Mol Sci. 2022. PMID: 36555437 Free PMC article. - The Estrogen-Induced miR-19 Downregulates Secretory Leucoprotease Inhibitor Expression in Monocytes.
McKiernan PJ, Smith SGJ, Durham AL, Adcock IM, McElvaney NG, Greene CM. McKiernan PJ, et al. J Innate Immun. 2020;12(1):90-102. doi: 10.1159/000500419. Epub 2019 Jul 2. J Innate Immun. 2020. PMID: 31266011 Free PMC article. - MiR-455-3p inhibits the degenerate process of chondrogenic differentiation through modification of DNA methylation.
Sun H, Zhao X, Zhang C, Zhang Z, Lun J, Liao W, Zhang Z. Sun H, et al. Cell Death Dis. 2018 May 1;9(5):537. doi: 10.1038/s41419-018-0565-2. Cell Death Dis. 2018. PMID: 29748607 Free PMC article.
References
- Selbach M, Schwanhausser B, Thierfelder N, Fang Z, Khanin R, Rajewsky N. Widespread changes in protein synthesis induced by microRNAs. Nature. 2008;455:58–63. - PubMed
- Png KJ, Halberg N, Yoshida M, Tavazoie SF. A microRNA regulon that mediates endothelial recruitment and metastasis by cancer cells. Nature. 2012;481:190–194. - PubMed
Publication types
MeSH terms
Substances
LinkOut - more resources
Full Text Sources
Molecular Biology Databases


