Detection of high-risk atherosclerotic plaque: report of the NHLBI Working Group on current status and future directions - PubMed (original) (raw)
Review
doi: 10.1016/j.jcmg.2012.07.007.
Gregg W Stone, Zahi A Fayad, Juan F Granada, Thomas S Hatsukami, Frank D Kolodgie, Jacques Ohayon, Roderic Pettigrew, Marc S Sabatine, Guillermo J Tearney, Sergio Waxman, Michael J Domanski, Pothur R Srinivas, Jagat Narula
Affiliations
- PMID: 22974808
- PMCID: PMC3646061
- DOI: 10.1016/j.jcmg.2012.07.007
Review
Detection of high-risk atherosclerotic plaque: report of the NHLBI Working Group on current status and future directions
Jerome L Fleg et al. JACC Cardiovasc Imaging. 2012 Sep.
Abstract
The leading cause of major morbidity and mortality in most countries around the world is atherosclerotic cardiovascular disease, most commonly caused by thrombotic occlusion of a high-risk coronary plaque resulting in myocardial infarction or cardiac death, or embolization from a high-risk carotid plaque resulting in stroke. The lesions prone to result in such clinical events are termed vulnerable or high-risk plaques, and their identification may lead to the development of pharmacological and mechanical intervention strategies to prevent such events. Autopsy studies from patients dying of acute myocardial infarction or sudden death have shown that such events typically arise from specific types of atherosclerotic plaques, most commonly the thin-cap fibroatheroma. However, the search in human beings for vulnerable plaques before their becoming symptomatic has been elusive. Recently, the PROSPECT (Providing Regional Observations to Study Predictors of Events in the Coronary Tree) study demonstrated that coronary plaques that are likely to cause future cardiac events, regardless of angiographic severity, are characterized by large plaque burden and small lumen area and/or are thin-cap fibroatheromas verified by radiofrequency intravascular ultrasound imaging. This study opened the door to identifying additional invasive and noninvasive imaging modalities that may improve detection of high-risk atherosclerotic lesions and patients. Beyond classic risk factors, novel biomarkers and genetic profiling may identify those patients in whom noninvasive imaging for vulnerable plaque screening, followed by invasive imaging for risk confirmation is warranted, and in whom future pharmacological and/or device-based focal or regional therapies may be applied to improve long-term prognosis.
Copyright © 2012 American College of Cardiology Foundation. Published by Elsevier Inc. All rights reserved.
Figures
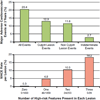
Figure 1. Natural History of Coronary Artery Lesions in ACS: The PROSPECT Study
(Top) Natural history of treated and untreated coronary artery lesions in patients with acute coronary syndromes. Incidence of major adverse cardiac events (MACE) (cardiac death, cardiac arrest, myocardial infarction, or rehospitalization due to unstable or progressive angina) at 3 years after successful percutaneous coronary intervention (PCI) for acute coronary syndrome in 697 patients from the PROSPECT study. Among the 20.4% of patients experiencing events, lesions originally treated by PCI (culprit lesions) and untreated (nonculprit) lesions accounted for nearly equal numbers of events. A small proportion of events were of indeterminate lesion origin because coronary angiography was not performed at the time of the event. (Bottom) The rate of MACE per lesion during median follow-up of 3.4 years according to the number of high-risk PROSPECT lesion characteristics at baseline. The high-risk characteristics are a plaque burden ≥70%, a minimal lumen area ≤4.0 mm2, and a thin-cap fibroatheroma as assessed by virtual histology intravascular ultrasound. The fraction below the x-axis is the number of candidate lesions with each combination of events (denominator) and the number of those lesions that resulted in a MACE event during follow-up (numerator). Adapted, with permission, from Stone et al. (1).
Figure 2. Representative Lesion Morphologies for Progressive Human Coronary Atherosclerosis
(A) The earliest atherosclerotic lesion, pathological intimal thickening, highlighted by lipid pools (LP) in the deep intima (Movat pentachrome stain) with CD68+ macrophages near the luminal surface. (B) Fibroatheroma with early necrosis, showing the conversion of a lipid pool into a necrotic core; note the invasion of the lipid pool by macrophages. (C) A late core fibroatheroma, distinguished by its lytic environment and increase in size. (D) An advanced thin-cap fibroatheroma (rupture-prone lesion), characterized by a relatively large necrotic core and thin fibrous cap infiltrated by macrophages. NC = necrotic core. Adapted, with permission, from Virmani R, Burke AP, Farb A, Gold HK, Finn AV, Kolodgie FD. Plaque rupture. In: Virmani R, Narula J, Leon M, Willerson J, editors. The Vulnerable Atherosclerotic Plaque: Strategies for Diagnosis and Management. Malden, MA: Blackwell Futura, 2007:37–59.
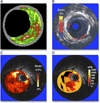
Figure 3. Various Intravascular Ultrasound Imaging Modalities to Assess Coronary Plaques
(A) Plaque composition (virtual histology); courtesy of G. Finet. (B) Palpography; reprinted with permission from Schaar et al. (21). (C) Strain map (or elastogram); reprinted, with permission, from Le Floc’h et al. (22). (D) Elasticity map (or modulogram); reprinted, with permission, from Maurice et al. (20). The elastogram and modulogram in C and D were obtained from the same vulnerable plaque.
Figure 4. Graph Highlighting the Influences of Remodeling Index and Relative Necrotic Core Thickness on Critical TCFA Thickness
The critical thin-cap fibroatheroma (TCFA) thickness is defined as the value at which cap stress reaches the critical or rupture point tensile stress. Vulnerable plaques with relative necrotic core thicknesses of 90%, 70%, 50%, 30%, and 10% become unstable below their respective curves. Thus, the unstable region for vulnerable plaques with relative necrotic core thickness of 10% is indicated in light gray, whereas for 30% thickness, the unstable region is the summation of gray and green light areas. Plaques with low remodeling index and a large relative necrotic core thickness are more prone to rupture, having a higher critical TCFA thickness. Reprinted, with permission, from Ohayon et al. (18).
Figure 5. NIRS Scan of a and Corresponding Coronary Angiogram
(Top) Cineangiographic frame of the right coronary artery of a 68-year-old man with unstable angina. There is a severe, irregular culprit stenosis in the mid-portion of the artery. (Bottom) Corresponding near-infrared spectroscopy (NIRS) chemogram reveals a prominent lipid core plaque (LCP) signal between 25 and 31 mm that colocalizes with the culprit stenosis. There are 2 more proximal LCP signals between 43 and 58 mm (A) that probably correspond to a single plaque mass in an angiographically normal segment of the vessel. The block chemogram, which provides a summary of the data, shows the strongest LCP signals between 26 to 31 mm, 45 to 47 mm, and 51 to 57 mm. Adapted, with permission, from Waxman et al. (27).
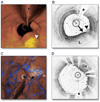
Figure 6. Optical Frequency Domain Imaging of the Left Anterior Descending Coronary Artery, Obtained In Vivo
(A) Fly-through view (proximal-distal) demonstrates a yellow, elevated lesion with scattered macrophages. (B) Optical frequency domain cross-sectional imaging obtained at the location of the white arrowhead in (A) shows a necrotic lipid core (L). A thin cap is present (black arrow) with a dense band of macrophages at the cap–lipid pool interface. A thin flap of tissue (black arrowhead) can be seen over the cap. Adapted, with permission, from Tearney et al. (30). (C) Fly-through view (proximal-distal), demonstrates a calcified lesion underneath a stent. (D) Optical frequency domain cross-sectional imaging obtained at the location of the black arrow in (C) shows a large calcific nodule (Ca) underneath the stent, from 11 to 5 o’clock. (A and C) Artery wall in red, macrophages in green, lipid pool in yellow, stent in blue. Tick marks, 1 mm. Asterisks denote guidewire artifact.
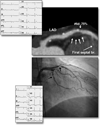
Figure 7. Morphological Characteristics on Coronary CTA of an Atherosclerotic Lesion Resulting in ACS
(Top) Curved multiplanar reformation image of the left anterior descending artery (LAD) shows positive remodeling, low-attenuation plaque, and spotty calcification at site 6 on computed tomography angiography (CTA). (Bottom) Acute coronary syndrome (ACS) occurred 6 months after CTA. LAD site 6 was the culprit lesion based on invasive coronary angiography. The electrocardiograms at initial presentation and during the subsequent event are shown. Reprinted, with permission, from Motoyama et al. (39).
Figure 8. Morphological Characteristics of Carotid Artery Atherosclerosis Using MRI
3-T magnetic resonance imaging (MRI) of a plaque in the right common carotid artery demonstrates fibrous cap rupture with ulcer formation (yellow arrows). The crescent-shaped high-signal region in the proton density-weighted (PDW), T2-weighted (T2W), and contrast-enhanced T1-weighted (CE-T1W) images correspond to a region of thrombus formation, shown on the matched histology section (hematoxylin and eosin stain). TOF = time of flight. Adapted, with permission, from Chu B, Ferguson MS, Underhill H, et al. Detection of carotid atherosclerotic plaque ulceration, calcification, and thrombosis by multicontrast weighted magnetic resonance imaging. Circulation 2005;112:e3– 4.
Figure 9. Imaging Arterial Inflammation Using FDG-PET
(A) Patient demonstrating enhanced aortic uptake of fluorodeoxyglucose (FDG) on positron emission tomography (PET) scan, indicating inflammation in the arterial wall due to atherosclerosis. (B) Co-registered FDG-PET/computed tomography images showing FDG uptake at the left main coronary artery trifurcation (solid arrow) in a patient with acute coronary syndrome. Aortic FDG uptake is indicated by the dashed arrow. In such patients, both aortic and coronary artery FDG uptake was increased compared with patients with stable coronary artery disease. Image courtesy of Dr. Zahi A. Fayad.
Similar articles
- Clinical and angiographic characteristics of patients likely to have vulnerable plaques: analysis from the PROSPECT study.
Bourantas CV, Garcia-Garcia HM, Farooq V, Maehara A, Xu K, Généreux P, Diletti R, Muramatsu T, Fahy M, Weisz G, Stone GW, Serruys PW. Bourantas CV, et al. JACC Cardiovasc Imaging. 2013 Dec;6(12):1263-72. doi: 10.1016/j.jcmg.2013.04.015. Epub 2013 Oct 23. JACC Cardiovasc Imaging. 2013. PMID: 24269259 - Relationship between palpography and virtual histology in patients with acute coronary syndromes.
Brugaletta S, Garcia-Garcia HM, Serruys PW, Maehara A, Farooq V, Mintz GS, de Bruyne B, Marso SP, Verheye S, Dudek D, Hamm CW, Farhat N, Schiele F, McPherson J, Lerman A, Moreno PR, Wennerblom B, Fahy M, Templin B, Morel MA, van Es GA, Stone GW. Brugaletta S, et al. JACC Cardiovasc Imaging. 2012 Mar;5(3 Suppl):S19-27. doi: 10.1016/j.jcmg.2011.02.026. JACC Cardiovasc Imaging. 2012. PMID: 22421227 - Heterogeneity of Plaque Structural Stress Is Increased in Plaques Leading to MACE: Insights From the PROSPECT Study.
Costopoulos C, Maehara A, Huang Y, Brown AJ, Gillard JH, Teng Z, Stone GW, Bennett MR. Costopoulos C, et al. JACC Cardiovasc Imaging. 2020 May;13(5):1206-1218. doi: 10.1016/j.jcmg.2019.05.024. Epub 2019 Jul 17. JACC Cardiovasc Imaging. 2020. PMID: 31326476 Free PMC article. - Non-invasive and invasive imaging of vulnerable coronary plaque.
Celeng C, Takx RA, Ferencik M, Maurovich-Horvat P. Celeng C, et al. Trends Cardiovasc Med. 2016 Aug;26(6):538-47. doi: 10.1016/j.tcm.2016.03.005. Epub 2016 Mar 15. Trends Cardiovasc Med. 2016. PMID: 27079893 Review. - Noninvasive imaging of the vulnerable atherosclerotic plaque.
ten Kate GL, Sijbrands EJ, Staub D, Coll B, ten Cate FJ, Feinstein SB, Schinkel AF. ten Kate GL, et al. Curr Probl Cardiol. 2010 Nov;35(11):556-91. doi: 10.1016/j.cpcardiol.2010.09.002. Curr Probl Cardiol. 2010. PMID: 20974314 Review.
Cited by
- Ultrasound tissue characterization of vulnerable atherosclerotic plaque.
Picano E, Paterni M. Picano E, et al. Int J Mol Sci. 2015 May 5;16(5):10121-33. doi: 10.3390/ijms160510121. Int J Mol Sci. 2015. PMID: 25950760 Free PMC article. Review. - Pericoronary Adipose Tissue Computed Tomography Attenuation and High-Risk Plaque Characteristics in Acute Coronary Syndrome Compared With Stable Coronary Artery Disease.
Goeller M, Achenbach S, Cadet S, Kwan AC, Commandeur F, Slomka PJ, Gransar H, Albrecht MH, Tamarappoo BK, Berman DS, Marwan M, Dey D. Goeller M, et al. JAMA Cardiol. 2018 Sep 1;3(9):858-863. doi: 10.1001/jamacardio.2018.1997. JAMA Cardiol. 2018. PMID: 30027285 Free PMC article. - A phase 1, first-in-human study of 18F-GP1 positron emission tomography for imaging acute arterial thrombosis.
Chae SY, Kwon TW, Jin S, Kwon SU, Sung C, Oh SJ, Lee SJ, Oh JS, Han Y, Cho YP, Lee N, Kim JY, Koglin N, Berndt M, Stephens AW, Moon DH. Chae SY, et al. EJNMMI Res. 2019 Jan 7;9(1):3. doi: 10.1186/s13550-018-0471-8. EJNMMI Res. 2019. PMID: 30617563 Free PMC article. - Ultrasound-Based Image Analysis for Predicting Carotid Artery Stenosis Risk: A Comprehensive Review of the Problem, Techniques, Datasets, and Future Directions.
Ottakath N, Al-Maadeed S, Zughaier SM, Elharrouss O, Mohammed HH, Chowdhury MEH, Bouridane A. Ottakath N, et al. Diagnostics (Basel). 2023 Aug 7;13(15):2614. doi: 10.3390/diagnostics13152614. Diagnostics (Basel). 2023. PMID: 37568976 Free PMC article. Review. - Positron emission tomography of the vulnerable atherosclerotic plaque in man--a contemporary review.
Pedersen SF, Hag AM, Klausen TL, Ripa RS, Bodholdt RP, Kjaer A. Pedersen SF, et al. Clin Physiol Funct Imaging. 2014 Nov;34(6):413-25. doi: 10.1111/cpf.12105. Epub 2013 Dec 1. Clin Physiol Funct Imaging. 2014. PMID: 24289282 Free PMC article. Review.
References
- Stone GW, Maehara A, Lansky AJ, et al. A prospective natural-history study of coronary atherosclerosis. N Engl J Med. 2011;364:226–235. - PubMed
- Muller JE, Tofler GH, Stone PH. Circadian variation and triggers of onset of acute cardiovascular disease. Circulation. 1989;79:733–743. - PubMed
- Virmani R, Burke AP, Farb A, Kolodgie FD. Pathology of the vulnerable plaque. J Am Cardiol. 2006;47(Suppl 8):C13–C18. - PubMed
- Ellis SG, Alderman E, Cain K, Fisher L, Sanders W, Bourassa M the CASS Investigators. Risk of anterior myocardial infarction by lesion severity and measurement method of stenoses in the left anterior descending coronary distribution: a CASS registry study. J Am Coll Cardiol. 1988;11:908–916. - PubMed
- Ambrose JA, Tannenbaum MA, Alexopoulos D, et al. Angiographic progression of coronary artery disease and the development of myocardial infarction. J Am Coll Cardiol. 1988;12:56–62. - PubMed
Publication types
MeSH terms
Substances
LinkOut - more resources
Full Text Sources
Other Literature Sources
Medical
Miscellaneous


