LKB1 tumor suppressor regulates AMP kinase/mTOR-independent cell growth and proliferation via the phosphorylation of Yap - PubMed (original) (raw)
LKB1 tumor suppressor regulates AMP kinase/mTOR-independent cell growth and proliferation via the phosphorylation of Yap
H B Nguyen et al. Oncogene. 2013.
Abstract
The liver kinase B1 (LKB1) tumor suppressor inhibits cell growth through its regulation of cellular metabolism and apical-basal polarity. The best understood mechanism whereby LKB1 limits cell growth is through activation of the AMP-activated-protein-kinase/mammalian-target-of-rapamycin (AMPK/mTOR) pathway to control metabolism. As LKB1 is also required for polarized epithelial cells to resist hyperplasia, it is anticipated to function through additional mechanisms. Recently, Yes-associated protein (Yap) has emerged as a transcriptional co-activator that modulates tissue homeostasis in response to cell-cell contact. Thus this study examined a possible connection between Yap and LKB1. Restoration of LKB1 expression in HeLa cells, which lack this tumor suppressor, or short-hairpin RNA knockdown of LKB1 in NTERT immortalized keratinocytes, demonstrated that LKB1 promotes Yap phosphorylation, nuclear exclusion and proteasomal degradation. The ability of phosphorylation-defective Yap mutants to rescue LKB1 phenotypes, such as reduced cell proliferation and cell size, suggest that Yap inhibition contributes to LKB1 tumor suppressor function(s). However, failure of Lats1/2 knockdown to suppress LKB1-mediated Yap regulation suggested that LKB1 signals to Yap via a non-canonical pathway. Additionally, LKB1 inhibited Yap independently of either AMPK or mTOR activation. These findings reveal a novel mechanism whereby LKB1 may restrict cancer cell growth via the inhibition of Yap.
Conflict of interest statement
Conflict of interest
The authors declare no conflict of interest.
Figures
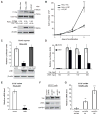
Figure 1. LKB1 increased Yap phosphorylation while inhibiting Yap dependent transcription and cell growth
A) The relative levels of Yap, phospho-YapSer127, LKB1 and β-actin were detected by immunoblot analysis of HeLa cell lysates prepared following infection with lentivirus expressing LKB1 (HeLa LKB1) or GFP control (HeLa Vec) vectors and compared to uninfected NTERT immortalized human keratinocytes. The mean ratio of phospho-YapSer127/YapTotal from three experiments is indicated below a representative immunoblot. B) After seeding 5×10⁴ cells/plate, trypan blue-excluded cells were counted in triplicate on the indicated days by hemocytometer. The mean number of HeLa Vec (◇) or HeLa LKB1 (■), and NTERT immortalized human keratinocytes (▲) were plotted. C) HeLa cells were co-transfected with a luciferase reporter system containing a TEAD response element along with WT LKB1, kinase-dead LKB1or empty vector. Yap-dependent transcription was inferred from luciferase signals after 48 hr and LKB1 expression confirmed by immunoblot. D) TEAD-driven transcription was measured as in Figure 1c using HeLa cells transfected with the indicated amount of LKB1 and Yap expressing plasmids (fixed Yap level). E) Endogenous HeLa cell CTGF transcript was measured by RT-PCR following transfection with control or LKB1-encoding plasmids. F) NTERT cells were infected with two independent lentiviruses encoding LKB1 shRNAs (#1 and #2) or a non-specific control sequence. After stable selection on puromycin, the relative levels of endogenous LKB1 and GAPDH from these lysates was measured by immunoblot. G) CTGF mRNA was measured in NTERT cells as in Fig 1e following stable expression of LKB1 shRNAs #1 or #2 or a non-specific control sequence. Luciferase data are representative of at least three independent experiments performed in triplicate. qRT-PCR is representative of two experiments performed in quadruplicate. Error was computed as standard deviation of the mean. Significance was computed by student T-test where p-values are indicated by * < 0.05; ** < 0.01; *** < 0.001; N.S., not significant.
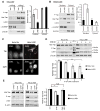
Figure 2. LKB1 expression decreases Yap nuclear localization and stability in HeLa cells
A) The relative levels of Yap, phospho-YapSer127, LKB1, U1snRNP and β-actin were measured by immunoblot from nucleus- and cytosol-enriched fractions prepared from HeLa cells stably expressing LKB1 (HeLa LKB1) or GFP control vector (HeLa Vec). B) NTERT cells were treated as in Fig 2A. C) HeLa LKB1 and HeLa Vec cells were fixed and immunostained for Yap. Nuclei were counterstained with DAPI. D) HeLa LKB1 and HeLa Vec cells grown at low density were treated with 100 μg/ml cycloheximide (CHX) for the indicated times. The levels of Yap, phospho-YapSer127, LKB1 and β-actin were measured by immunoblot analysis from cell lysates (upper panel). The average Yap levels from three independent experiments were also computed (lower panel). E) HeLa LKB1 and HeLa Vec cells were treated with CHX and 10 μM MG132 for 2 hr. Protein levels were then measured by immunoblot analysis (left panel). The average levels of Yap from three independent experiments are also shown (right panel). Errors and significances are represented as in Figure 1.
Figure 3. The ability of LKB1 to suppress Yap dependent transcription and cell growth is partially reversed by phosphorylation-deficient Yap mutants
A) HeLa cells were transfected with Yap- wild type (WT), S127A, or 5SA in combination with vector control or LKB1. TEAD dependent transcription was measured as described in Figure 1c. B) HeLa cells were co-infected with LKB1 and vector control (◇), YapWT (■), YapS127A (▲), and Yap5SA (X) mutants. Following puromycin selection, cell accumulation was measured as in Figure 1b. Error and significance are represented as described in Figure 1. C) HeLa cells stably expressing the indicated cDNAs were imaged after 10 days culture in Matrigel. Representative images are shown. Insets are 2-fold increase magnification of colonies.
Figure 4. LKB1-induced cell shrinkage is partially reversed by expression of YapS127A or Yap5SA
A) HeLa cells infected with a lentivirus carrying LKB1 and GFP (separated by a T2A self-cleaving peptide) or GFP alone were analyzed by flow cytometry forward scatter (FSC). Two sub-populations were observed in GFP/LKB1 add-back cells: one with high and one with low GFP signal. B) The mean FSC of each population described in Figure 4a was calculated as an arbitrary unit of cell size, which was then normalized to vector control to obtain relative cell size. Three samples of each population were analyzed and the average relative sizes presented. C) NTERT cells were treated as in 4A/B. D) Stable cell lines generated from co-infection with LKB1 and Yap transcripts as described in Figure 3b were sorted by GFP signals/LKB1 expression. Cell sizes were then analyzed. The mean FSCs were normalized to vector control, averaged from three samples, and presented as mean ± S.D. All results are representative of at least two independent experiments performed in triplicate. * p < 0.05; ** p < 0.01; N.S. not significant
Figure 5. LKB1 regulates Yap independently of mTOR or AMPK activation
A) HeLa cells were co-transfected with LKB1, Rheb and/or control vector as indicated. After 24 hr, cells were treated with the mTOR kinase inhibitor Torin1 (250 nM) for 16 hr. TEAD-luciferase activity was then measured as in Figure 1c. HA-Rheb, LKB1, phospho-S6K, total S6K and β-actin were measured as controls for protein expression and mTOR activity. B) HeLa Vec and HeLa LKB1 cells were glucose starved for up to 3 hr as indicated. Lysates were then immunoblotted to measure phospho-YapSer127, Yap, phospho- and total acetyl CoA carboxylase (ACC), LKB1 and β-actin. AMPK activation was confirmed by increased ACC phosphorylation. The average levels of phospho-YapSer127 from three experiments are indicated in lower panel. C. HeLa cells were transiently transfected with indicated siRNAs and TEAD luciferase plasmids. TEAD-luciferase activity as well as Lats 1, Lats2, LKB1 and GAPDH were then measured. Figures A and B are representative of three experiments. Errors and significance are as described in Figure 1. C is representative of 2 independent experiments. ANOVA one way was performed to compare groups of four data points. N.S. not significant
Figure 6. Cellular structure promoted by LKB1 plays a role in creating and maintaining elevated phospho-Yap levels
A) Phase-contrast images suggested HeLa LKB1 cells have increase cell-cell attachment. B) YFP-tagged occluden (a component of tight junction) and cerulean histone 2B (a nuclear marker) were co-transfected with vector or untagged LKB1 into HeLa cells. Fluorescent live cell images were taken from vector control, LKB1 cells, and LKB1 cells after 6 min EGTA treatment. C) HeLa Vec and HeLa LKB1 cells were treated with EGTA to disrupt adherens junctions for indicated times. Lysates from these cells were immunoblotted for phospho-YapSer127, total Yap, LKB1 and β-actin (upper panel). The average levels of phospho-YapSer127 of Vec (◇) and LKB1 (■) cells from three experiments were also computed (lower panel). Blot and fluorescence images are representative. Error and significance are as described in Figure 1.
Similar articles
- Honokiol activates AMP-activated protein kinase in breast cancer cells via an LKB1-dependent pathway and inhibits breast carcinogenesis.
Nagalingam A, Arbiser JL, Bonner MY, Saxena NK, Sharma D. Nagalingam A, et al. Breast Cancer Res. 2012 Feb 21;14(1):R35. doi: 10.1186/bcr3128. Breast Cancer Res. 2012. PMID: 22353783 Free PMC article. - Energy stress regulates hippo-YAP signaling involving AMPK-mediated regulation of angiomotin-like 1 protein.
DeRan M, Yang J, Shen CH, Peters EC, Fitamant J, Chan P, Hsieh M, Zhu S, Asara JM, Zheng B, Bardeesy N, Liu J, Wu X. DeRan M, et al. Cell Rep. 2014 Oct 23;9(2):495-503. doi: 10.1016/j.celrep.2014.09.036. Epub 2014 Oct 16. Cell Rep. 2014. PMID: 25373897 Free PMC article. - Serum deprivation inhibits the transcriptional co-activator YAP and cell growth via phosphorylation of the 130-kDa isoform of Angiomotin by the LATS1/2 protein kinases.
Adler JJ, Johnson DE, Heller BL, Bringman LR, Ranahan WP, Conwell MD, Sun Y, Hudmon A, Wells CD. Adler JJ, et al. Proc Natl Acad Sci U S A. 2013 Oct 22;110(43):17368-73. doi: 10.1073/pnas.1308236110. Epub 2013 Oct 7. Proc Natl Acad Sci U S A. 2013. PMID: 24101513 Free PMC article. - LKB1 and AMP-activated protein kinase control of mTOR signalling and growth.
Shaw RJ. Shaw RJ. Acta Physiol (Oxf). 2009 May;196(1):65-80. doi: 10.1111/j.1748-1716.2009.01972.x. Epub 2009 Feb 19. Acta Physiol (Oxf). 2009. PMID: 19245654 Free PMC article. Review. - Control of YAP/TAZ Activity by Metabolic and Nutrient-Sensing Pathways.
Santinon G, Pocaterra A, Dupont S. Santinon G, et al. Trends Cell Biol. 2016 Apr;26(4):289-299. doi: 10.1016/j.tcb.2015.11.004. Epub 2015 Dec 30. Trends Cell Biol. 2016. PMID: 26750334 Review.
Cited by
- AMP-activated Protein Kinase Suppresses Biosynthesis of Glucosylceramide by Reducing Intracellular Sugar Nucleotides.
Ishibashi Y, Hirabayashi Y. Ishibashi Y, et al. J Biol Chem. 2015 Jul 17;290(29):18245-18260. doi: 10.1074/jbc.M115.658948. Epub 2015 Jun 5. J Biol Chem. 2015. PMID: 26048992 Free PMC article. - Crosstalk of lncRNA and Cellular Metabolism and Their Regulatory Mechanism in Cancer.
Lin YH. Lin YH. Int J Mol Sci. 2020 Apr 22;21(8):2947. doi: 10.3390/ijms21082947. Int J Mol Sci. 2020. PMID: 32331347 Free PMC article. Review. - Lkb1 deficiency confers glutamine dependency in polycystic kidney disease.
Flowers EM, Sudderth J, Zacharias L, Mernaugh G, Zent R, DeBerardinis RJ, Carroll TJ. Flowers EM, et al. Nat Commun. 2018 Feb 26;9(1):814. doi: 10.1038/s41467-018-03036-y. Nat Commun. 2018. PMID: 29483507 Free PMC article. - Fat4 suppression induces Yap translocation accounting for the promoted proliferation and migration of gastric cancer cells.
Ma L, Cui J, Xi H, Bian S, Wei B, Chen L. Ma L, et al. Cancer Biol Ther. 2016;17(1):36-47. doi: 10.1080/15384047.2015.1108488. Cancer Biol Ther. 2016. PMID: 26575609 Free PMC article. - Molecular Mechanisms and Potential Therapeutic Reversal of Pancreatic Cancer-Induced Immune Evasion.
Gan LL, Hii LW, Wong SF, Leong CO, Mai CW. Gan LL, et al. Cancers (Basel). 2020 Jul 11;12(7):1872. doi: 10.3390/cancers12071872. Cancers (Basel). 2020. PMID: 32664564 Free PMC article. Review.
References
- Bilder D. Epithelial polarity and proliferation control: links from the Drosophila neoplastic tumor suppressors. Genes Dev. 2004;18:1909–25. - PubMed
- Hezel AF, Bardeesy N. LKB1; linking cell structure and tumor suppression. Oncogene. 2008;27:6908–19. - PubMed
Publication types
MeSH terms
Substances
LinkOut - more resources
Full Text Sources
Other Literature Sources
Molecular Biology Databases
Research Materials
Miscellaneous


