Loss of imprinting and allelic switching at the DLK1-MEG3 locus in human hepatocellular carcinoma - PubMed (original) (raw)
Loss of imprinting and allelic switching at the DLK1-MEG3 locus in human hepatocellular carcinoma
Sumadi Lukman Anwar et al. PLoS One. 2012.
Abstract
Deregulation of imprinted genes is an important molecular mechanism contributing to the development of cancer in humans. However, knowledge about imprinting defects in human hepatocellular carcinoma (HCC), the third leading cause of cancer mortality worldwide, is still limited. Therefore, a systematic meta-analysis of the expression of 223 imprinted loci in human HCC was initiated. This screen revealed that the DLK1-MEG3 locus is frequently deregulated in HCC. Deregulation of DLK1 and MEG3 expression accompanied by extensive aberrations in DNA methylation could be confirmed experimentally in an independent series of human HCC (n = 40) in more than 80% of cases. Loss of methylation at the DLK1-MEG3 locus correlates linearly with global loss of DNA methylation in HCC (r(2) = 0.63, p<0.0001). Inhibition of DNMT1 in HCC cells using siRNA led to a reduction in MEG3-DMR methylation and concomitant increase in MEG3 RNA expression. Allele-specific expression analysis identified loss of imprinting in 10 out of 31 informative samples (32%), rendering it one of the most frequent molecular defects in human HCC. In 2 cases unequivocal gain of bi-allelic expression accompanied by substantial loss of methylation at the IG-DMR could be demonstrated. In 8 cases the tumour cells displayed allelic switching by mono-allelic expression of the normally imprinted allele. Allelic switching was accompanied by gains or losses of DNA methylation primarily at IG-DMR1. Analysis of 10 hepatocellular adenomas (HCA) and 5 cases of focal nodular hyperplasia (FNH) confirmed that this epigenetic instability is specifically associated with the process of malignant transformation and not linked to increased proliferation per se. This widespread imprint instability in human HCC has to be considered in order to minimize unwanted side-effects of therapeutic approaches targeting the DNA methylation machinery. It might also serve in the future as predictive biomarker and for monitoring response to epigenetic therapy.
Conflict of interest statement
Competing Interests: The authors have declared that no competing interests exist.
Figures
Figure 1. Schematic representation of the DLK1-MEG3 imprinted locus on chromosome 14q32.
Maternally expressed genes are depicted in black and paternally expressed genes in grey. The intergenic differentially methylated region (IG-DMR) is located approximately 14 kb upstream to the first exon of MEG3. Studies in patients with UPD chromosome 14 revealed two regions with differential methylation at IG-DMR . Therefore two pyrosequencing assays were developed at this region (_IG-DMR_1 and 2). In addition, three pyrosequencing assays were designed for one CpG island and two CTCF binding sites within the _MEG3_-DMR which was found to display parent-of-origin specific methylation (_MEG3_-DMR1, 2, and 3). Horizontal bar represents scale of 100 kbp.
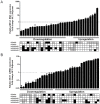
Figure 2. Expression and DNA methylation of MEG3 RNA and DLK1 mRNA in primary human HCC.
MEG3 RNA (A) and _DLK_1 mRNA (B) expression was measured in a series of 34 paired HCC using quantitative RT-PCR. For every sample, the RNA and mRNA levels were normalized to the mean expression of GUSB and GAPDH. Expression in primary HCC samples was then normalized to the corresponding adjacent non-cancerous liver tissues. Relative expression is presented as fold change in a logarithmic scale. Samples were classified as “up-regulated” if the lower limit of the 98% confidence interval was larger than 1 and “down-regulated” if the upper limit was smaller than 1. DNA methylation levels were measured using high-resolution quantitative pyrosequencing and are displayed below the expression data as hypermethylated (black box), hypomethylated (light grey) or normomethylated (white box). For definition of thresholds see Materials and Methods. The computed methylation levels are the average of two independent pyrosequencing runs. The pyrosequencing assays for _IG-DMR_1, _IG-DMR_2, and _MEG3-DMR_1 contain 5 CG sites, for _MEG3-DMR_2 9 CG sites, for MEG3-DMR3 6 CG sites. A positive association of high methylation with reduced MEG3 expression (panel A), left part) and reduced methylation and low DLK1 expression (panel B), left part) is clearly visible.
Figure 3. Relationship between DNA methylation and gene expression at the DLK1-MEG3 locus.
Primary HCC samples are defined as “hypermethylated” and “hypomethylated” using mean ±2×SD of the methylation levels of the adjacent non-cancerous liver tissues. Relative MEG3 and DLK1 expression is then compared among hyper-, normo-, and hypo-methylated subgroups. The horizontal lines inside the box represents the median of relative MEG3 expression and the upper and lower edges of each box represent the 75th and 25th percentile respectively, while the bars denote the highest and lowest relative expression measured. * = 0.001<p<0.05, ** = 0.0001<p<0.001.
Figure 4. Restoration of _MEG_3-RNA and _DLK_1 mRNA expression after _DNMT_1 knock down and reduction of methylation at MEG3 imprinting loci.
(A) Quantitative MEG3 RNA and (B) _DLK_1 mRNA expression levels in HLE cells after _DNMT_1 knockdown after normalization to GUSB and GAPDH levels (p = 0.029). (C) Reduction of DNA methylation at DLK1/MEG3 imprinting locus after _DNMT_1 knock down (DLK1p: DLK1 promoter). Methylation analysis was performed using quantitative pyrosequencing. Paired t-test showed significant decrease of methylation after _DNMT_1 knockdown for all six regions. Values shown for qRT-PCR and DNA methylation analysis are means from two independent DNMT1-knockdown experiments (50 nM and 100 nM) and two different negative control siRNAs. * = 0.001<p<0.05, *** = p<0.0001.
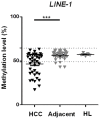
Figure 5. Global DNA methylation level in primary human liver specimens.
The global DNA methylation level in primary HCC samples, the corresponding adjacent non-cancerous liver tissues, as well as in unrelated healthy liver tissue was determined employing quantitative pyrosequencing of LINE1 sequences as described . Methylation levels at LINE-1 locus were significantly lower in primary HCC samples compared to the corresponding adjacent non-cancerous liver tissues. Dashed lines represent cut off values defining hyper- or hypomethylation (mean+/−2× std).
Figure 6. Allele-specific expression analysis of the DLK1-MEG3 locus in human HCC.
Quantitative SNP analysis was performed using pyrosequencing at a C/G polymorphism in exon 3, at SNP Rs8013873 for _MEG_3 and SNP Rs1802710 for _DLK_1. In tumour specimens showing genomic DNA polymorphisms, further SNP analysis was performed with the cDNAs from the same sample as well as with genomic and cDNA from the corresponding adjacent non-cancerous liver tissues. (A) Pyrosequencing analysis of the cDNA at SNP Rs8013873 shows mono-allelic _MEG_3 expression in HCC specimen #8 and bi-allelic expression in HCC specimen #21. (B) Pyrosequencing analysis of the cDNA at SNP Rs1802710 shows mono-allelic _DLK_1 expression in HCC specimen #33 and bi-allelic expression in HCC specimen #20. (C) _MEG_3 allelic switching is shown in case #25. Informative polymorphisms are found in the genomic DNAs of both tumour and the adjacent non-cancerous tissues and T/T expression in cDNA tumour but C/C expression in cDNA adjacent liver tissues. (D) _DLK_1 allelic switching is shown in case #30 with informative polymorphisms in the genomic DNAs of both tumour and the adjacent non-cancerous tissues and C/C expression in tumour cDNA but T/T expression in cDNA from the adjacent liver tissues. The confirmation of all genotyping results by Sanger sequencing is shown in Figure S5.
Figure 7. DNA methylation analysis of the IG-DMR1 of the DLK1-MEG3 locus in human HCC.
A) Gain of bi-allelic expression is accompanied by substantial loss of methylation. B) Tumour samples displaying retention of the original imprinting pattern by strict mono-allelic expression of the same allele as in the adjacent non-cancerous liver tissue show only minor variations in DNA methylation. C) Tumour samples demonstrating allelic switching (i.e., mono-allelic expression from the normally silenced imprinted allele) show variable changes of DNA methylation patterns to an intermediate degree. The numbers in the lower left corner of each bisulfite sequencing panel are the methylation values for the region according to pyrosequencing. “G” and “A” denote the sequence at SNP Rs12437020, which allows in heterozygous samples the differentiation of the two alleles. For the calculation of the statistical significance of the changes in DNA methylation the methylation level for each clone was calculated by computing the fraction of methylated CpG sites. From these values a mean methylation level of the tumor and adjacent liver tissue sample, respectively, was calculated. These two mean values were compared using Mann-Whitney-U-test and the p-values are depicted below the schematic representation of the bisulfite sequencing results.
Similar articles
- Increased methylation upstream of the MEG3 promotor is observed in acute myeloid leukemia patients with better overall survival.
Sellers ZP, Bolkun L, Kloczko J, Wojtaszewska ML, Lewandowski K, Moniuszko M, Ratajczak MZ, Schneider G. Sellers ZP, et al. Clin Epigenetics. 2019 Mar 15;11(1):50. doi: 10.1186/s13148-019-0643-z. Clin Epigenetics. 2019. PMID: 30876483 Free PMC article. - Analysis of the Paternally-Imprinted DLK1-MEG3 and IGF2-H19 Tandem Gene Loci in NT2 Embryonal Carcinoma Cells Identifies DLK1 as a Potential Therapeutic Target.
Sellers ZP, Schneider G, Maj M, Ratajczak MZ. Sellers ZP, et al. Stem Cell Rev Rep. 2018 Dec;14(6):823-836. doi: 10.1007/s12015-018-9838-5. Stem Cell Rev Rep. 2018. PMID: 29980981 - Abnormal DLK1/MEG3 imprinting correlates with decreased HERV-K methylation after assisted reproduction and preimplantation genetic diagnosis.
Dimitriadou E, Noutsopoulos D, Markopoulos G, Vlaikou AM, Mantziou S, Traeger-Synodinos J, Kanavakis E, Chrousos GP, Tzavaras T, Syrrou M. Dimitriadou E, et al. Stress. 2013 Nov;16(6):689-97. doi: 10.3109/10253890.2013.817554. Epub 2013 Jul 25. Stress. 2013. PMID: 23786541 - Long noncoding RNA, the methylation of genomic elements and their emerging crosstalk in hepatocellular carcinoma.
Yuan SX, Zhang J, Xu QG, Yang Y, Zhou WP. Yuan SX, et al. Cancer Lett. 2016 Sep 1;379(2):239-44. doi: 10.1016/j.canlet.2015.08.008. Epub 2015 Aug 14. Cancer Lett. 2016. PMID: 26282784 Review. - DLK1-DIO3 imprinted locus deregulation in development, respiratory disease, and cancer.
Enterina JR, Enfield KSS, Anderson C, Marshall EA, Ng KW, Lam WL. Enterina JR, et al. Expert Rev Respir Med. 2017 Sep;11(9):749-761. doi: 10.1080/17476348.2017.1355241. Epub 2017 Jul 20. Expert Rev Respir Med. 2017. PMID: 28715922 Review.
Cited by
- Non-Coding RNAs in Primary Liver Cancer.
Ghidini M, Braconi C. Ghidini M, et al. Front Med (Lausanne). 2015 Jun 4;2:36. doi: 10.3389/fmed.2015.00036. eCollection 2015. Front Med (Lausanne). 2015. PMID: 26131450 Free PMC article. Review. - The concomitant loss of APC and HNF4α in adult hepatocytes does not contribute to hepatocarcinogenesis driven by β-catenin activation.
Sartor C, Bachelot L, Godard C, Lager F, Renault G, Gonzalez FJ, Perret C, Gougelet A, Colnot S. Sartor C, et al. Liver Int. 2019 Apr;39(4):727-739. doi: 10.1111/liv.14068. Epub 2019 Feb 24. Liver Int. 2019. PMID: 30721564 Free PMC article. - MEG3/miR‑21 axis affects cell mobility by suppressing epithelial‑mesenchymal transition in gastric cancer.
Xu G, Meng L, Yuan D, Li K, Zhang Y, Dang C, Zhu K. Xu G, et al. Oncol Rep. 2018 Jul;40(1):39-48. doi: 10.3892/or.2018.6424. Epub 2018 May 8. Oncol Rep. 2018. PMID: 29749532 Free PMC article. Retracted. - The Role of Long Non-Coding RNAs in Hepatocarcinogenesis.
Lanzafame M, Bianco G, Terracciano LM, Ng CKY, Piscuoglio S. Lanzafame M, et al. Int J Mol Sci. 2018 Feb 28;19(3):682. doi: 10.3390/ijms19030682. Int J Mol Sci. 2018. PMID: 29495592 Free PMC article. Review. - Down regulated lncRNA MEG3 eliminates mycobacteria in macrophages via autophagy.
Pawar K, Hanisch C, Palma Vera SE, Einspanier R, Sharbati S. Pawar K, et al. Sci Rep. 2016 Jan 13;6:19416. doi: 10.1038/srep19416. Sci Rep. 2016. PMID: 26757825 Free PMC article.
References
- Knudson AG (2002) Cancer genetics. Am J Med Genet 111: 96–102. - PubMed
- Iacobuzio-Donahue CA (2008) Epigenetic Changes in Cancer. Annu Rev Pathol - PubMed
- Morison IM, Ramsay JP, Spencer HG (2005) A census of mammalian imprinting. Trends in genetics : TIG 21: 457–465. - PubMed
- Varmuza S, Mann M (1994) Genomic imprinting–defusing the ovarian time bomb. Trends Genet 10: 118–123. - PubMed
- Youngson NA, Whitelaw E (2008) Transgenerational epigenetic effects. Annu Rev Genomics Hum Genet 9: 233–257. - PubMed
Publication types
MeSH terms
Substances
Grants and funding
This work was supported by a grant from the German Research Council within the Hannover-Heidelberg Transregio-SFB TRR 77 “Liver cancer” (Project B1). The funders had no role in study design, data collection and analysis, decision to publish, or preparation of the manuscript.
LinkOut - more resources
Full Text Sources
Other Literature Sources
Medical


