Merck Ad5/HIV induces broad innate immune activation that predicts CD8⁺ T-cell responses but is attenuated by preexisting Ad5 immunity - PubMed (original) (raw)
. 2012 Dec 11;109(50):E3503-12.
doi: 10.1073/pnas.1208972109. Epub 2012 Nov 14.
Erica Andersen-Nissen, Eric R Peterson, Alicia Sato, M Kristina Hamilton, Joleen Borgerding, Akshay T Krishnamurty, Joanne T Chang, Devin J Adams, Tiffany R Hensley, Alexander I Salter, Cecilia A Morgan, Ann C Duerr, Stephen C De Rosa, Alan Aderem, M Juliana McElrath
Affiliations
- PMID: 23151505
- PMCID: PMC3528489
- DOI: 10.1073/pnas.1208972109
Merck Ad5/HIV induces broad innate immune activation that predicts CD8⁺ T-cell responses but is attenuated by preexisting Ad5 immunity
Daniel E Zak et al. Proc Natl Acad Sci U S A. 2012.
Abstract
To better understand how innate immune responses to vaccination can lead to lasting protective immunity, we used a systems approach to define immune signatures in humans over 1 wk following MRKAd5/HIV vaccination that predicted subsequent HIV-specific T-cell responses. Within 24 h, striking increases in peripheral blood mononuclear cell gene expression associated with inflammation, IFN response, and myeloid cell trafficking occurred, and lymphocyte-specific transcripts decreased. These alterations were corroborated by marked serum inflammatory cytokine elevations and egress of circulating lymphocytes. Responses of vaccinees with preexisting adenovirus serotype 5 (Ad5) neutralizing antibodies were strongly attenuated, suggesting that enhanced HIV acquisition in Ad5-seropositive subgroups in the Step Study may relate to the lack of appropriate innate activation rather than to increased systemic immune activation. Importantly, patterns of chemoattractant cytokine responses at 24 h and alterations in 209 peripheral blood mononuclear cell transcripts at 72 h were predictive of subsequent induction and magnitude of HIV-specific CD8(+) T-cell responses. This systems approach provides a framework to compare innate responses induced by vectors, as shown here by contrasting the more rapid, robust response to MRKAd5/HIV with that to yellow fever vaccine. When applied iteratively, the findings may permit selection of HIV vaccine candidates eliciting innate immune response profiles more likely to drive HIV protective immunity.
Conflict of interest statement
The authors declare no conflict of interest.
Figures
Fig. 1.
Systems analysis identifies widespread innate immune activation and cellular trafficking responses response to MRKAd5/HIV vaccination in humans. (A) In vivo PBMC transcriptional responses to vaccination with MRKAd5/HIV [n = 7 Ad5 seronegative individuals, false-discovery rate (FDR) ≤ 10%, absolute average log2 fold-change ≥ 0.5]. Genes significantly differentially expressed in response to MRKAd5/HIV vaccination at any time point are annotated and grouped according to membership in functional gene modules (21, 64). Each column represents subject-specific log2(fold-changes) compared with prevaccination. To emphasize regulation patterns, expression fold-changes for each gene are scaled by the maximum observed expression response. Pink intensity indicates up-regulation compared with prevaccination, cyan indicates down-regulation. (B) Functional gene modules significantly differentially expressed in PBMC in response to vaccination. Each black line represents the average log2(fold change) of all genes in the module for a single subject. Up-regulated modules have values >0, down-regulated modules have values <0. FDR < 10%, |average log2(fold-change)|>0.5. (C) Quantitative RT-PCR validation of the differential expression of module-associated genes identified by microarray analysis. Each line represents the response of one individual (n = 7). (D) Protein-level validation of vaccine-induced cytokine and chemokine differential expression by multiplex analyte analysis. (E) Validation of vaccine-induced cellular fluxes predicted by module-level analysis of the PBMC transcriptional responses. *P < 0.05 with Hochberg adjustment from the statistical model assessing change in concentration over time.
Fig. 2.
Responses to MRKAd5/HIV are recapitulated in vitro and involve coordinate regulation of an innate immune network involving unique gene isoforms. (A and B) In vitro responses of modules regulated by MRKAd5/HIV in vivo. Each black line represents the average log2 fold-change of all genes in the module for PBMC derived from separate donors and stimulated in vitro (n = 4); red line indicates average module-level response in vivo. *P ≤ 0.01 comparing module fold-changes observed in vitro those observed in vivo. (A) Gene modules consistently regulated by MRKAd5 in vivo and in vitro. (B) Gene modules regulated in vivo but not in vitro. (C) Single gene heatmaps showing average exon-level expression responses to MRKAd5/HIV in vivo (n = 7) and in vitro (n = 4). Pink intensity indicates up-regulation, cyan indicates down-regulation. (D) Innate immune response interaction network of genes consistently induced in response to MRKAd5 in vivo and in vitro, arranged by representative subcellular localization. Node colors indicate functional module associations; node shapes indicate the mode of differential expression. Red lines indicate protein-protein interactions, gray lines indicate mutual membership in common complexes, and blue edges indicate protein–DNA interactions.
Fig. 3.
Preexisting Ad5 neutralizing antibodies attenuate the MRKAd5/HIV-induced innate immune response in vivo. (A) Effect of Ad5 nAbs on gene modules regulated by MRKAd5/HIV. Black line represents the average fold-change of all genes in the modules, averaged over 8 Ad5 nAb ≤ 200 subjects. Green lines represent the average fold-change of all genes in the module for the two Ad5 nAb > 200 subjects. (B) Attenuated induction of critical innate immunity pathways in Ad5 nAb > 200 compared with Ad5 nAb ≤ 200 subjects. Nodes are colored according to average extent of induction in Ad5 nAb ≤ 200 subjects at 24 h (Left) and average extent of response attenuation in Ad5 nAb > 200 subjects compared with Ad5 nAb ≤ 200 subjects (Right). Edges represent protein–protein interactions between nodes obtained from InnateDB (65). (C) Representative attenuation of MRKAd5/HIV serum cytokine induction in Ad5 nAb > 200 subjects. Serum IP-10/CXCL10 concentrations are contrasted between Ad5 nAb ≤ 200 (n = 27) and Ad5 nAb > 200 (n = 6) individuals. Shading represents the interquartile ranges with the 75th percentile shown on top and the 25th percentile shown below the median line. *P < 0.05 after Hochberg adjustment.
Fig. 4.
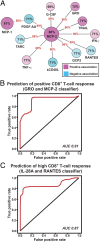
Vaccine-induced serum cytokine and chemokine responses predict the magnitudes of CD8+ T-cell responses induced by MRKAd5/HIV. (A) Network depiction of serum cytokines and chemokines with 24-h vaccine-induced fold-changes that discriminate subjects who develop CD8+ T-cell responses (28 d after vaccination) from those who do not. Node sizes indicate predictive accuracy of the factors individually (percentages inside nodes), node color, and intensity indicate positive (pink) or negative (blue) correlations between induction levels of the factor and CD8+ T-cell response magnitudes. The presence of an edge between nodes indicates that the two cytokines in combination have increased predictive accuracy compared with either cytokine alone. Edge width is proportional to predictive accuracy of the pair-wise signature of the connected nodes (red percentages). (B) ROC for predicting which subjects will develop CD8+ T-cell responses, based on 24-h vaccine induced fold-changes of GRO and MCP-2 in a LDA model. The red line indicates the tradeoff in false positive rate required as the true positive rate is increased. Prediction accuracies were estimated from over 60 rounds of eightfold cross-validation. AUC, area under the curve. (C) ROC for predicting which subjects will develop high magnitude CD8+ T-cell responses, based on 24-h vaccine induced fold-changes of IL-28A and RANTES in a LDA model. Notation is as in B.
Fig. 5.
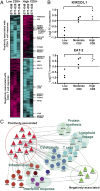
Systems analysis identifies innate immune response genes that are associated with the immunogenicity of MRKAd5/HIV. (A) The 209 genes with 72-h MRKAd5/HIV-induced expression responses that are positively (Upper) or negatively (Lower) associated with the magnitude of MRKAd5/HIV-induced CD8+ T-cell responses. Subjects with low and high magnitude CD8+ T-cell responses are on the Left and Right halves of the heatmap, respectively. Gene selection criteria: FDR ≤ 20% and |average log2(fold-change)| ≥ 0.5. Rows are scaled as in Fig. 1_A_. Pink intensity indicates up-regulation compared with prevaccination, cyan indicates down-regulation. (B) Seventy-two hour MRKAd5/HIV-induced expression responses of two representative genes, stratified by the magnitude of the CD8+ T-cell responses observed in the same subjects. (C) Protein–protein interaction network emphasizing links between CD8+ T-cell response-associated genes identified in Fig. 5_A_ (triangles) and constituents of functional gene modules differentially regulated by MRKAd5/HIV (circles), colored according to module associations.
Fig. 6.
MRKAd5 induces more extensive innate immune activation than the gold-standard yellow fever vaccine, YF-17D. (A) MRKAd5/HIV and YF-17D trigger innate immune responses in PBMC with distinct kinetics in vivo. The number of genes significantly up-regulated (upper half) or down-regulated (lower half) in response to vaccination with MRKAd5/HIV (red, present study) or YF-17D [blue (19)] are plotted. Significant differential expression defined as FDR ≤ 10%, |average[log2(fold-change)]| > 0.5; n = 7 (MRKAd5/HIV), n = 25 (YF-17D). (B) MRKAd5/HIV regulates a broader spectrum of gene modules in vivo than does YF-17D. Each line represents the average fold-change of all genes in a module for a given individual (red lines, MRKAd5/HIV vaccines; blue lines, YF-17D vaccinees). Modules labeled in red differ significantly between MRKAd5/HIV and YF-17D in vivo (FDR ≤ 10%), modules labeled with asterisks differ significantly between MRKAd5 and YF-17D in vivo and in vitro (FDR ≤ 10%). (C) Average expression responses in vivo and in vitro of 43 genes preferentially induced by MRKAd5. Genes associated with functional gene modules are indicated. Rows are scaled as in Fig. 1_A_. Pink intensity indicates up-regulation compared with controls, cyan indicates down-regulation. FDR < 10%, |average log2(fold-change)|>0.5 for induction in response to MRKAd5 and comparing MRKAd5 to YF-17D, in vivo and in vitro. (D) Putative transcriptional regulatory network controlling innate immune responses preferentially induced by MRKAd5. Squares indicate transcription factors preferentially induced by MRKAd5 in vivo and in vitro; circles indicate target genes preferentially induced (pink) or repressed (light blue) by MRKAd5 in vivo and in vitro. Lines indicate protein-DNA transcription factor–target gene interactions identified from published ChIP-seq datasets [blue, KLF4 targets (38); purple, IRF1 targets (37); orange, STAT5A targets (39)]. Pink edges indicate IRF1 target genes identified by conventional methods (–68). (E) Expression responses of CRIP3 and NPB (72–168 h postvaccination) are negatively associated with CD8+ T-cell response magnitudes induced by MRKAd5/HIV and YF-17D. Shown are log2(fold-changes) compared with prevaccination of the two genes for both vaccines, stratified by the magnitudes of vaccine-induced CD8+ T-cell responses observed in the same subjects. Lines indicate mean values.
Fig. P1.
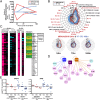
Systems-level analysis of the Step Study HIV vaccine. (A) MRKAd5/HIV induces IFN response genes and represses lymphoid cell-associated genes. This effect is shown in a gene module radar plot in which the axes indicate average expression of specific functional gene modules (“M” followed by a number). Responses are attenuated in moderate Ad5 neutralizing antibody (nAb) titer (green lines) compared with low nAb titer (black line) volunteers. (B) Similarly, induction of IP-10 by MRKAd5/HIV in serum was attenuated in moderate Ad5 nAb titer (n = 6, red) compared with low titer (n = 27, blue) volunteers. (C) MRKAd5/HIV induces transcriptional responses that involve more genes but are shorter-lived than YF-17D. (D) A subset of MRKAd5/HIV innate immune response genes (72 h postvaccination) are associated with HIV-specific CD8+ T-cell responses (1 mo postvaccination). For example, CRIP3 is inversely correlated with both MRKAd5/HIV and YF-17D–induced CD8+ T-cell responses.
Similar articles
- Safety and immunogenicity of the Merck adenovirus serotype 5 (MRKAd5) and MRKAd6 human immunodeficiency virus type 1 trigene vaccines alone and in combination in healthy adults.
Harro C, Sun X, Stek JE, Leavitt RY, Mehrotra DV, Wang F, Bett AJ, Casimiro DR, Shiver JW, DiNubile MJ, Quirk E; Merck V526-001 Study Group. Harro C, et al. Clin Vaccine Immunol. 2009 Sep;16(9):1285-92. doi: 10.1128/CVI.00144-09. Epub 2009 Jul 15. Clin Vaccine Immunol. 2009. PMID: 19605598 Free PMC article. Clinical Trial. - Comparative immunogenicity in rhesus monkeys of DNA plasmid, recombinant vaccinia virus, and replication-defective adenovirus vectors expressing a human immunodeficiency virus type 1 gag gene.
Casimiro DR, Chen L, Fu TM, Evans RK, Caulfield MJ, Davies ME, Tang A, Chen M, Huang L, Harris V, Freed DC, Wilson KA, Dubey S, Zhu DM, Nawrocki D, Mach H, Troutman R, Isopi L, Williams D, Hurni W, Xu Z, Smith JG, Wang S, Liu X, Guan L, Long R, Trigona W, Heidecker GJ, Perry HC, Persaud N, Toner TJ, Su Q, Liang X, Youil R, Chastain M, Bett AJ, Volkin DB, Emini EA, Shiver JW. Casimiro DR, et al. J Virol. 2003 Jun;77(11):6305-13. doi: 10.1128/jvi.77.11.6305-6313.2003. J Virol. 2003. PMID: 12743287 Free PMC article. - Overview of STEP and Phambili trial results: two phase IIb test-of-concept studies investigating the efficacy of MRK adenovirus type 5 gag/pol/nef subtype B HIV vaccine.
Gray G, Buchbinder S, Duerr A. Gray G, et al. Curr Opin HIV AIDS. 2010 Sep;5(5):357-61. doi: 10.1097/COH.0b013e32833d2d2b. Curr Opin HIV AIDS. 2010. PMID: 20978374 Free PMC article. Review. - Living in a house of cards: re-evaluating CD8+ T-cell immune correlates against HIV.
Makedonas G, Betts MR. Makedonas G, et al. Immunol Rev. 2011 Jan;239(1):109-24. doi: 10.1111/j.1600-065X.2010.00968.x. Immunol Rev. 2011. PMID: 21198668 Free PMC article. Review.
Cited by
- Enhancing antibody responses by multivalent antigen display on thymus-independent DNA origami scaffolds.
Wamhoff EC, Ronsard L, Feldman J, Knappe GA, Hauser BM, Romanov A, Lam E, Denis KS, Boucau J, Barczak AK, Balazs AB, Schmidt A, Lingwood D, Bathe M. Wamhoff EC, et al. bioRxiv [Preprint]. 2023 Jun 19:2022.08.16.504128. doi: 10.1101/2022.08.16.504128. bioRxiv. 2023. PMID: 36032975 Free PMC article. Updated. Preprint. - The protective immunity induced by intranasally inoculated serotype 63 chimpanzee adenovirus vector expressing human respiratory syncytial virus prefusion fusion glycoprotein in BALB/c mice.
Huang L, Liu MQ, Wan CQ, Cheng NN, Su YB, Zheng YP, Peng XL, Yu JM, Fu YH, He JS. Huang L, et al. Front Microbiol. 2022 Nov 18;13:1041338. doi: 10.3389/fmicb.2022.1041338. eCollection 2022. Front Microbiol. 2022. PMID: 36466668 Free PMC article. - Understanding Post Entry Sorting of Adenovirus Capsids; A Chance to Change Vaccine Vector Properties.
Daussy CF, Pied N, Wodrich H. Daussy CF, et al. Viruses. 2021 Jun 24;13(7):1221. doi: 10.3390/v13071221. Viruses. 2021. PMID: 34202573 Free PMC article. Review. - A third generation vaccine for human visceral leishmaniasis and post kala azar dermal leishmaniasis: First-in-human trial of ChAd63-KH.
Osman M, Mistry A, Keding A, Gabe R, Cook E, Forrester S, Wiggins R, Di Marco S, Colloca S, Siani L, Cortese R, Smith DF, Aebischer T, Kaye PM, Lacey CJ. Osman M, et al. PLoS Negl Trop Dis. 2017 May 12;11(5):e0005527. doi: 10.1371/journal.pntd.0005527. eCollection 2017 May. PLoS Negl Trop Dis. 2017. PMID: 28498840 Free PMC article. Clinical Trial. - A replication-incompetent adenoviral vector encoding for HSV-2 gD2 is immunogenic and protective against HSV-2 intravaginal challenge in mice.
Rossetti E, Vujadinovic M, van Huizen E, Tolboom J, Schuitemaker H, Yao F, Zahn R, Saeland E. Rossetti E, et al. PLoS One. 2024 Dec 31;19(12):e0310250. doi: 10.1371/journal.pone.0310250. eCollection 2024. PLoS One. 2024. PMID: 39739963 Free PMC article.
References
- Rerks-Ngarm S, et al. MOPH-TAVEG Investigators Vaccination with ALVAC and AIDSVAX to prevent HIV-1 infection in Thailand. N Engl J Med. 2009;361(23):2209–2220. - PubMed
Publication types
MeSH terms
Substances
Grants and funding
- U01 AI069481/AI/NIAID NIH HHS/United States
- T32 AI007140/AI/NIAID NIH HHS/United States
- UM1 AI069481/AI/NIAID NIH HHS/United States
- UM1 AI068614/AI/NIAID NIH HHS/United States
- UM1 AI068618/AI/NIAID NIH HHS/United States
- T32 GM007266/GM/NIGMS NIH HHS/United States
LinkOut - more resources
Full Text Sources
Other Literature Sources
Molecular Biology Databases
Research Materials


