Visualizing hippocampal neurons with in vivo two-photon microscopy using a 1030 nm picosecond pulse laser - PubMed (original) (raw)
Visualizing hippocampal neurons with in vivo two-photon microscopy using a 1030 nm picosecond pulse laser
Ryosuke Kawakami et al. Sci Rep. 2013.
Abstract
In vivo two-photon microscopy has revealed vital information on neural activity for brain function, even in light of its limitation in imaging events at depths greater than several hundred micrometers from the brain surface. We developed a novel semiconductor-laser-based light source with a wavelength of 1030 nm that can generate pulses of 5-picosecond duration with 2-W output power, and a 20-MHz repetition rate. We also developed a system to secure the head of the mouse under an upright microscope stage that has a horizontal adjustment mechanism. We examined the penetration depth while imaging the H-Line mouse brain and demonstrated that our newly developed laser successfully images not only cortex pyramidal neurons spreading to all cortex layers at a superior signal-to-background ratio, but also images hippocampal CA1 neurons in a young adult mouse.
Figures
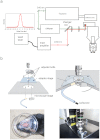
Figure 1. Schematic diagrams for in vivo two-photon microscopy using a novel picosecond pulse laser and a system to secure the head of mouse under standard upright microscope stage.
(a) Optical arrangement for the 1030-nm picosecond (newly developed) and 910-nm femto-second (Ti:Sapphire) lasers to be introduced into the microscope. The optical pathway from each laser is shown in green and red lines, respectively. The duration of an individual pulse of the 1030-nm laser beam was about 5 picoseconds (left). (b) The newly developed apparatus, with a horizontal adjustment mechanism, to secure the head of the mouse under an upright microscope stage. Three adjuster bolts are located on the adapter stage, and a 35-mm disposable dish was mounted on the head of the mouse. The mouse head was suspended from the adapter stage by the 35-mm dish, and the body was held under the stage by soft cloth. The stage angle could be manually controlled by adjuster bolt to ensure that the cover slip and objective lens were parallel, which would reduce optical aberrations.
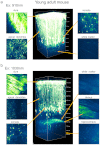
Figure 2. Two-photon fluorescence imaging of cortical and hippocampal CA1 pyramidal neurons with 910-nm femto-second and 1030-nm picosecond excitation in a young adult H-line mouse brain.
(a) Maximum intensity projections of three-dimensional stacks were obtained with 910-nm and 1030-nm lasers (b). Four normalized xy frames from the _z_-stack at various depths are shown, including the dura matter, apical dendrite, soma, white matter, and hippocampus, respectively (left panel). The arrowhead shows a part of a basal dendritic process at cortex layer V.
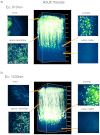
Figure 3. Two-photon fluorescence imaging of cortical pyramidal neurons with 910-nm and 1030-nm excitation in an adult H-line mouse brain.
(a) Maximum intensity projections of three-dimensional stacks were obtained with 910-nm and 1030-nm lasers (b). Four normalized xy frames from the _z_-stack at various depths including the dura matter, apical dendrite, soma, and white matter, respectively (left panels). The arrowhead shows a part of a basal dendritic process at cortex layer V.
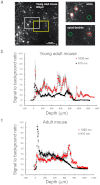
Figure 4. Quantitative analysis of signal-to-background ratios for in vivo imaging of neurons in the live mouse brain.
(a) A cross-sectional- (_xy_-) image obtained at 600-μm depth in a young adult mouse. The left white or left yellow box indicates the “soma” (upper right) or “apical dendrite” (lower right) region, respectively. In the upper and lower right panels, the averages of “signal” and “background” were calculated from fluorescence intensities in a circle (20 μm diameter) around an individual neural process (“signal”: red circle) and the background area (“background”: green circle), respectively. Ratio R at the each process was obtained from the average signal divided by the background (see Experimental procedure). Depth dependence of the average and SEM of signal-to-background ratios (R) obtained in the young adult (b) and the adult mouse (c). Red and black circles indicate averages with the 1030-nm picosecond and 910-nm femto-second lasers, respectively (n = 7 processes, ±: SEM).
Similar articles
- In vivo two-photon imaging of mouse hippocampal neurons in dentate gyrus using a light source based on a high-peak power gain-switched laser diode.
Kawakami R, Sawada K, Kusama Y, Fang YC, Kanazawa S, Kozawa Y, Sato S, Yokoyama H, Nemoto T. Kawakami R, et al. Biomed Opt Express. 2015 Feb 20;6(3):891-901. doi: 10.1364/BOE.6.000891. eCollection 2015 Mar 1. Biomed Opt Express. 2015. PMID: 25798313 Free PMC article. - Two-photon fluorescence bioimaging with an all-semiconductor laser picosecond pulse source.
Kuramoto M, Kitajima N, Guo H, Furushima Y, Ikeda M, Yokoyama H. Kuramoto M, et al. Opt Lett. 2007 Sep 15;32(18):2726-8. doi: 10.1364/ol.32.002726. Opt Lett. 2007. PMID: 17873949 - Two-photon bioimaging utilizing supercontinuum light generated by a high-peak-power picosecond semiconductor laser source.
Yokoyama H, Tsubokawa H, Guo H, Shikata J, Sato K, Takashima K, Kashiwagi K, Saito N, Taniguchi H, Ito H. Yokoyama H, et al. J Biomed Opt. 2007 Sep-Oct;12(5):054019. doi: 10.1117/1.2800393. J Biomed Opt. 2007. PMID: 17994907 - Advanced observation of brain and nerve cells using two-photon microscopy with novel techniques.
Ishii H, Takahashi T, Yamaguchi K, Nemoto T. Ishii H, et al. Microscopy (Oxf). 2023 Apr 6;72(2):144-150. doi: 10.1093/jmicro/dfac047. Microscopy (Oxf). 2023. PMID: 36130254 Review. - Multiphoton microscopy in life sciences.
König K. König K. J Microsc. 2000 Nov;200(Pt 2):83-104. doi: 10.1046/j.1365-2818.2000.00738.x. J Microsc. 2000. PMID: 11106949 Review.
Cited by
- In vivo two-photon microscopic observation and ablation in deeper brain regions realized by modifications of excitation beam diameter and immersion liquid.
Yamaguchi K, Kitamura R, Kawakami R, Otomo K, Nemoto T. Yamaguchi K, et al. PLoS One. 2020 Aug 7;15(8):e0237230. doi: 10.1371/journal.pone.0237230. eCollection 2020. PLoS One. 2020. PMID: 32764808 Free PMC article. - Addressing the autofluorescence issue in deep tissue imaging by two-photon microscopy: the significance of far-red emitting dyes.
Jun YW, Kim HR, Reo YJ, Dai M, Ahn KH. Jun YW, et al. Chem Sci. 2017 Nov 1;8(11):7696-7704. doi: 10.1039/c7sc03362a. Epub 2017 Sep 18. Chem Sci. 2017. PMID: 29568432 Free PMC article. - Protocol for constructing an extensive cranial window utilizing a PEO-CYTOP nanosheet for in vivo wide-field imaging of the mouse brain.
Takahashi T, Zhang H, Otomo K, Okamura Y, Nemoto T. Takahashi T, et al. STAR Protoc. 2021 May 12;2(2):100542. doi: 10.1016/j.xpro.2021.100542. eCollection 2021 Jun 18. STAR Protoc. 2021. PMID: 34027495 Free PMC article. - Advances in Two-Photon Imaging in Plants.
Mizuta Y. Mizuta Y. Plant Cell Physiol. 2021 Nov 10;62(8):1224-1230. doi: 10.1093/pcp/pcab062. Plant Cell Physiol. 2021. PMID: 34019083 Free PMC article. Review. - Two-photon STED nanoscopy realizing 100-nm spatial resolution utilizing high-peak-power sub-nanosecond 655-nm pulses.
Ishii H, Otomo K, Hung JH, Tsutsumi M, Yokoyama H, Nemoto T. Ishii H, et al. Biomed Opt Express. 2019 Jun 3;10(7):3104-3113. doi: 10.1364/BOE.10.003104. eCollection 2019 Jul 1. Biomed Opt Express. 2019. PMID: 31467771 Free PMC article.
References
- Nicholson D. A. et al. Distance-dependent differences in synapse number and AMPA receptor expression in hippocampal CA1 pyramidal neurons. Neuron 50, 431–442 (2006). - PubMed
- Grutzendler J., Kasthuri N. & Gan W. B. Long-term dendritic spine stability in the adult cortex. Nature 420, 812–816 (2002). - PubMed
- Nemoto T. Living cell functions and morphology revealed by two-photon microscopy in intact neural and secretory organs. Mol Cells 26, 113–120 (2008). - PubMed
Publication types
MeSH terms
Substances
LinkOut - more resources
Full Text Sources
Other Literature Sources
Miscellaneous


