Role of N-ε- carboxy methyl lysine, advanced glycation end products and reactive oxygen species for the development of nonproliferative and proliferative retinopathy in type 2 diabetes mellitus - PubMed (original) (raw)
Role of N-ε- carboxy methyl lysine, advanced glycation end products and reactive oxygen species for the development of nonproliferative and proliferative retinopathy in type 2 diabetes mellitus
Subhadip Choudhuri et al. Mol Vis. 2013.
Abstract
Purpose: The aim of the present study was to evaluate the collective role of N-epsilon-carboxy methyl lysine (N(ε)-CML), advanced glycation end-products (AGEs), and reactive oxygen species (ROS) for the development of retinopathy among type 2 diabetic subjects.
Methods: Seventy type 2 diabetic subjects with nonproliferative diabetic retinopathy (NPDR), 105 subjects with proliferative diabetic retinopathy (PDR), and 102 patients with diabetes but without retinopathy (DNR) were enrolled in this study. In addition, 95 normal individuals without diabetes were enrolled as healthy controls in this study. Serum and vitreous N(ε)-CML and AGEs were measured by enzyme-linked immunosorbent assay. The peripheral blood mononuclear cell (PBMC) ROS level was measured by flow cytometric analysis. Serum and PBMC total thiols were measured by spectrophotometry.
Results: Serum AGEs and N(ε)-CML levels were significantly elevated in subjects with PDR (p<0.0001) and NPDR (p=0.0297 and p<0.0001, respectively) compared to DNR subjects. Further vitreous AGEs and N(ε)-CML levels were found to be significantly high among PDR subjects compared to the control group (p<0.0001). PBMC ROS production was found to be strikingly high among NPDR (p<0.0001) and PDR (p<0.0001) subjects as compared to the DNR group. Serum and PBMC total thiol levels were remarkably decreased in NPDR (p<0.0001 and p=0.0043, respectively) and PDR (p=0.0108 and p=0.0332 respectively) subjects than those were considered as DNR.
Conclusions: Our findings suggest that N(ε)-CML and ROS are the key modulators for the development of nonproliferative retinopathy among poorly controlled type 2 diabetic subjects. Furthermore, AGEs under persistent oxidative stress and the deprived antioxidant state might instigate the pathogenic process of retinopathy from the nonproliferative to the proliferative state.
Figures
Figure 1
Serum and vitreous advanced glycation end-product levels among the different study groups. A: The box-and-whisker plot represents the median and minimum to maximum range of serum advanced glycation end-product (AGE) levels (µg/ml) among the different study groups. The serum AGE level was significantly elevated in subjects with proliferative diabetic retinopathy (PDR; p<0.0001) and nonproliferative diabetic retinopathy (NPDR; p=0.0297) compared to diabetes without retinopathy (DNR) subjects. Further, PDR subjects showed a higher level of serum AGEs than the NPDR group, but the difference was not statistically significant (p=0.2643). The level was found strikingly lower among healthy control (HC) subjects than those considered DNR (p<0.0001). Serum level of AGEs was measured in 105 subjects with PDR, 70 subjects with NPDR, 102 subjects with DNR and from 95 subjects considered as HC. B: The box-and-whisker plot represents the median and minimum to maximum range of vitreous AGE levels (µg/ml) among both the study groups. The vitreous level of AGEs was found to be significantly high among PDR subjects compared to the control group (p<0.0001). In this study, vitreous AGEs was measured among 45 subjects with PDR and 32 subjects considered as control.
Figure 2
Serum and vitreous N-epsilon–carboxy methyl lysine levels among the different study groups. A: The box-and-whisker plot represents the median and minimum to maximum range of serum N-epsilon–carboxy methyl lysine (_N_ε-CML) levels (ng/ml) among the different study groups. The serum _N_ε-CML level was remarkably elevated among nonproliferative diabetic retinopathy (NPDR; p<0.0001) and proliferative diabetic retinopathy (PDR; p<0.0001) subjects compared to the diabetes without retinopathy (DNR) group. However, NPDR subjects showed significant higher levels of _N_ε-CML compared to the PDR group, and the difference was statistically significant (p=0.017). B: The box-and-whisker plot represents the median and minimum to maximum range of vitreous _N_ε-CML levels (ng/ml) among both study groups. The vitreous level of _N_ε-CML was found to be strikingly high among PDR subjects compared to the control group (p<0.0001).
Figure 3
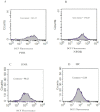
Histogram of peripheral blood mononuclear cell reactive oxygen species (PBMC ROS) level. The histograms in A, B, C, and D represent the geomean of PBMC dichlorofluorescein (DCF) fluorescence as a measure of ROS level among proliferative diabetic retinopathy (PDR), nonproliferative diabetic retinopathy (NPDR), diabetes without retinopathy (DNR), and healthy control (HC) subjects, respectively.
Figure 4
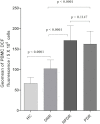
Peripheral blood mononuclear cell reactive oxygen species (PBMC ROS) levels in the different study groups. The bar columns represent the PBMC ROS level, which was expressed as mean±standard deviation (SD) of the geomean of DCF fluorescence/5x105 cells among the study subjects. PBMC ROS production was found to be significantly high among nonproliferative diabetic retinopathy (NPDR) and proliferative diabetic retinopathy (PDR) subjects compared to diabetes without retinopathy (DNR) subjects (p<0.0001). A further increased trend of ROS production was observed among NPDR subjects than those with PDR. However, this production was not statistically significant (p=0.1147), whereas the level of ROS was found to be significantly lower among healthy control (HC) subjects even compared to the DNR group (p<0.0001).
Figure 5
Correlation between serum advanced glycation end products (AGEs) and peripheral blood mononuclear cell reactive oxygen species (PBMC ROS) levels. A, B, C, D: The XY scatterplot represents the correlation between serum AGE level and PBMC ROS level among healthy control (HC), diabetic without retinopathy (DNR), nonproliferative diabetic retinopathy (NPDR), and proliferative diabetic retinopathy (PDR) subjects. A significant correlation was observed in between serum AGE levels and PBMC ROS levels among subjects with PDR (p=0.0019; r=0.2991), NPDR (p=0.0044; r=0.3363), and DNR (p=0.0145; r=0.2415), but not in HC individuals (p=0.182; r=0.1381).
Figure 6
Correlation between serum N – epsilon carboxy methyl lysine (_N_ε-CML) and ” and peripheral blood mononuclear cell reactive oxygen species (PBMC ROS) level. A, B, C, D: The XY scatterplot represents the correlation between serum _N_ε-CML levels and PBMC ROS levels among healthy control (HC), diabetic without retinopathy (DNR), nonproliferative diabetic retinopathy (NPDR), and proliferative diabetic retinopathy (PDR) subjects. A significant correlation was observed in between serum _N_ε-CML levels and PBMC ROS levels among NPDR (p<0.0001; r=0.5687) and PDR (p=0.0034; r=0.2863) subjects, but no significant correlation was found in DNR (p=0.2344; r=0.1188) and HC individuals (p=0.3875; r=0.0896).
Figure 7
Serum and peripheral blood mononuclear cell (PBMC) total thiol level. A: The bar column represents the mean±standard deviation (SD) of total serum thiol level (mmol/l) among the different study groups. Total serum thiol levels were significantly decreased among nonproliferative diabetic retinopathy (NPDR; p<0.0001) and proliferative diabetic retinopathy (PDR; p=0.0108) subjects in comparison to those considered as having diabetes without retinopathy (DNR). The highest level of serum total thiol was found in healthy control (HC) subjects, even compared to the DNR group (p=0.0428). However, no significant difference was observed in total serum thiol level among NPDR and PDR subjects (p=0.0747). B: The bar columns represent the mean±standard deviation (SD) of PBMC total thiol levels (µmol/mg of protein) among the different study groups. The PBMC total thiol level was decreased significantly among NPDR (p=0.0043) and PDR (p=0.0332) subjects than those who were considered as DNR. The highest level of PBMC total thiol was found in HC subjects, even compared to the DNR group (p=0.0105). However, no significant difference was observed in PBMC total thiol levels between NPDR and PDR subjects (p=0.3568).
Similar articles
- Association of serum N(ε)-Carboxy methyl lysine with severity of diabetic retinopathy.
Mishra N, Saxena S, Shukla RK, Singh V, Meyer CH, Kruzliak P, Khanna VK. Mishra N, et al. J Diabetes Complications. 2016 Apr;30(3):511-7. doi: 10.1016/j.jdiacomp.2015.12.009. Epub 2015 Dec 11. J Diabetes Complications. 2016. PMID: 26782022 - Pentosidine and N-carboxymethyl-lysine: biomarkers for type 2 diabetic retinopathy.
Ghanem AA, Elewa A, Arafa LF. Ghanem AA, et al. Eur J Ophthalmol. 2011 Jan-Feb;21(1):48-54. doi: 10.5301/ejo.2010.4447. Eur J Ophthalmol. 2011. PMID: 20544678 - Increased levels of N(ε)- Carboxy methyl lysine (N(ε)-CML) are associated with topographic alterations in retinal pigment epithelium: A preliminary study.
Mishra N, Saxena S, Ruia S, Prasad S, Singh V, Khanna V, Staffa R, Gaspar L, Kruzliak P. Mishra N, et al. J Diabetes Complications. 2016 Jul;30(5):868-72. doi: 10.1016/j.jdiacomp.2016.03.011. Epub 2016 Mar 15. J Diabetes Complications. 2016. PMID: 27039312 - Proliferative retinopathy during hyperbaric oxygen treatment.
Tran V, Smart D. Tran V, et al. Diving Hyperb Med. 2017 Sep;47(3):203. doi: 10.28920/dhm47.3.203. Diving Hyperb Med. 2017. PMID: 28868603 Free PMC article. Review. - Advanced Glycation End-Products and Diabetic Neuropathy of the Retina.
Oshitari T. Oshitari T. Int J Mol Sci. 2023 Feb 2;24(3):2927. doi: 10.3390/ijms24032927. Int J Mol Sci. 2023. PMID: 36769249 Free PMC article. Review.
Cited by
- Levels of selected oxidative stress markers in the vitreous and serum of diabetic retinopathy patients.
Brzović-Šarić V, Landeka I, Šarić B, Barberić M, Andrijašević L, Cerovski B, Oršolić N, Đikić D. Brzović-Šarić V, et al. Mol Vis. 2015 Jun 12;21:649-64. eCollection 2015. Mol Vis. 2015. PMID: 26120270 Free PMC article. - Oxidative stress in diabetes: implications for vascular and other complications.
Pitocco D, Tesauro M, Alessandro R, Ghirlanda G, Cardillo C. Pitocco D, et al. Int J Mol Sci. 2013 Oct 30;14(11):21525-50. doi: 10.3390/ijms141121525. Int J Mol Sci. 2013. PMID: 24177571 Free PMC article. Review. - Molecular Markers of Diabetic Retinopathy: Potential Screening Tool of the Future?
Pusparajah P, Lee LH, Abdul Kadir K. Pusparajah P, et al. Front Physiol. 2016 Jun 1;7:200. doi: 10.3389/fphys.2016.00200. eCollection 2016. Front Physiol. 2016. PMID: 27313539 Free PMC article. Review. - Glycation Damage: A Possible Hub for Major Pathophysiological Disorders and Aging.
Fournet M, Bonté F, Desmoulière A. Fournet M, et al. Aging Dis. 2018 Oct 1;9(5):880-900. doi: 10.14336/AD.2017.1121. eCollection 2018 Oct. Aging Dis. 2018. PMID: 30271665 Free PMC article. Review. - Vitamin D suppresses cellular pathways of diabetes complication in liver.
Derakhshanian H, Djalali M, Mohammad Hassan MH, Alvandi E, Eshraghian MR, Mirshafiey A, Nadimi H, Jahanabadi S, Zarei M, Djazayery A. Derakhshanian H, et al. Iran J Basic Med Sci. 2019 Jun;22(6):690-694. doi: 10.22038/ijbms.2019.36054.8584. Iran J Basic Med Sci. 2019. PMID: 31231498 Free PMC article.
References
- Fong DS, Aiello LP, Ferris FL, Klein R. Diabetic retinopathy. Diabetes Care. 2004;27:2540–53. - PubMed
- Kern TS, Tang J, Mizutani M, Kowluru RA, Nagaraj RH, Romeo G, Podesta F, Lorenzi M. Response of capillary cell death to aminoguanidine predicts the development of retinopathy: comparison of diabetes and galactosemia. Invest Ophthalmol Vis Sci. 2000;41:3972–8. - PubMed
- Stitt AW. AGES and diabetic retinopathy. Invest Ophthalmol Vis Sci. 2010;51:4867–74. - PubMed
- Monnier VM, Sell DR, Genuth S. Glycation products as markers and predictors of the progression of diabetic complications. Ann N Y Acad Sci. 2005;1043:567–81. - PubMed
Publication types
MeSH terms
Substances
LinkOut - more resources
Full Text Sources
Other Literature Sources
Medical


