Acetylated Histone H3K9 is associated with meiotic recombination hotspots, and plays a role in recombination redundantly with other factors including the H3K4 methylase Set1 in fission yeast - PubMed (original) (raw)
Acetylated Histone H3K9 is associated with meiotic recombination hotspots, and plays a role in recombination redundantly with other factors including the H3K4 methylase Set1 in fission yeast
Shintaro Yamada et al. Nucleic Acids Res. 2013.
Abstract
Histone modifications are associated with meiotic recombination hotspots, discrete sites with augmented recombination frequency. For example, trimethylation of histone H3 lysine4 (H3K4me3) marks most hotspots in budding yeast and mouse. Modified histones are known to regulate meiotic recombination partly by promoting DNA double-strand break (DSB) formation at hotspots, but the role and precise landscape of involved modifications remain unclear. Here, we studied hotspot-associated modifications in fission yeast and found general features: acetylation of H3 lysine9 (H3K9ac) is elevated, and H3K4me3 is not significantly enriched. Mutating H3K9 to non-acetylatable alanine mildly reduced levels of the DSB-inducing protein Rec12 (the fission yeast homologue of Spo11) and DSB at hotspots, indicating that H3K9ac may be involved in DSB formation by enhancing the interaction between Rec12 and hotspots. In addition, we found that the lack of the H3K4 methyltransferase Set1 generally increased Rec12 binding to chromatin but partially reduced DSB formation at some loci, suggesting that Set1 is also involved in DSB formation. These results suggest that meiotic DSB formation is redundantly regulated by multiple chromatin-related factors including H3K9ac and Set1 in fission yeast.
Figures
Figure 1.
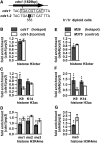
Histone H3 and modified histones at M26_-sequence-dependent hotspots, ade6-M26 and ade6-3049. The ad_e6-M26, ade6-M375, ade6-3049 and ade6-3057 cells in the haploid pat1-114 background were induced into meiosis and harvested 1 h after the induction. ChIP experiments were performed using an antibody specific to the histone H3 core domain, and antibodies specific to the modifications are shown underneath the _x_-axis. DNA isolated from immunoprecipitates and whole-cell extracts was analysed by real-time qPCR, where fragments corresponding to the hotspot or control loci (ade6), and the prp3+ promoter (prp3) were amplified. (A–J) Histone H3 and modified histone levels at ade6-M26 (filled bars) and ade6-M375 (open bars). (A) Positions of ade6-M26 and ade6-M375 within the ade6 gene and sequences around the two loci. The rectangle and white lettering indicate the _M26_-sequence and mutated bases, respectively. The numbers below the sequences indicate nucleotide position, with the first ‘A’ of the ade6 ORF as 1. (B) Histone H3 levels were calculated as the percentage of DNA fragments in histone H3cter immunoprecipitates relative to those in whole-cell extract and shown in the _y_-axis. (C–G) Histone modification levels were calculated by dividing signal intensities of modified histone immunoprecipitates with those of histone H3 immunoprecipitates and shown in the _y_-axes. The means and standard deviations from three independent experiments are shown. (C) H3K9ac levels. (D) H3K14ac levels. (E) H3K4me1 levels. (F) H3K4me2 levels. (G) H3K4me3 levels. (H) Relative Histone H3 levels at the ade6 locus normalized to prp3. ‘Fold enrichment’ values were calculated for individual experiments. Their means and standard deviations are shown. (I and J) Relative histone modification levels at ade6 normalized to prp3. ‘Fold enrichment’ values were calculated for individual experiments. Their means and standard deviations are shown. (I) H3K9ac (K9) and H3K14ac (K14) levels. (J) H3K4me1 (me1), H3K4me2 (me2) and H3K4me3 (me3) levels. (K–T) Histone H3 and modified histone levels at ade6-3049 (filled bars) and ade6-3057 (open bars). (K) Positions of ade6-3049 and ade6-3057 within the ade6 ORF and sequences around the two loci. The rectangle, white lettering and numbers below the sequences are as in (A). Note that the _M26_-sequence at ade6-3049 is on the complementary strand. (L) Histone H3 levels were calculated and shown as in (B). (M–Q) Histone modification levels were calculated and shown as in (C–G). (M) H3K9ac levels. (N) H3K14ac levels. (O) H3K4me1 levels. (P) H3K4me2 levels. (Q) H3K4me3 levels. (R) Histone H3 levels at the ade6 locus were calculated and shown as in (H). (S and T) Relative histone modification levels at ade6 were calculated and shown as in (I and J). (S) H3K9ac (K9) and H3K14ac (K14) levels. (T) H3K4me1 (me1), H3K4me2 (me2) and H3K4me3 (me3) levels.
Figure 2.
Histone H3 and its modifications at the natural _M26_-sequence-dependent hotspot _cds1-M26_ES-I3 and at ade6-M26 in meiotic diploid cells. (A–D) Histone H3 and its modification levels around _cds1-M26_ES-I3 (cds1+, filled bars) and cds1-2 (open bars). cds1+ and cds1-2 cells in a pat1-114 background were cultured, and histone H3 and its modification levels were assessed by ChIP as in Figure 1H–J. (A) Positions of _cds1-M26_ES-I3 and cds1-2 within the cds1 gene and sequences around the two loci. The rectangle and white lettering indicate the _M26_-sequence and mutated base, respectively. ‘553’ indicates nucleotide position, with the first ‘A’ of the cds1 ORF as 1. Note that the _M26_-sequence at _cds1-M26_ES-I3 is present on both strands. (B) Levels of Histone H3 (C) Levels of H3K9ac and H3K14ac. (D) Levels of H3K4me1, H3K4me2 and H3K4me3. (E–G) Histone H3 and its modification levels in h+/h− meiotic cells around ade6-M26 (filled bars) and ade6-M375 (open bars). The ade6-M26 and ade6-M375 h+/h− diploid cells were induced to enter meiosis by nitrogen withdrawal and harvested 3 h after the induction. Histone H3 and its modification levels were assessed by ChIP as in Figure 1H–J. (E) Levels of Histone H3. (F) Levels of H3K9ac and H3K14ac. (G) Levels of H3K4me3.
Figure 3.
Histone modifications associated with transcriptional activation at the ctt1+ promoter. Vegetatively growing ctt1+ and ctt1-mut cells in a pat1-114 background were treated with 1 mM H2O2 for an hour. (A) _M26_-sequence in the ctt1+ promoter. Sequences around the upstream region of ctt1 in ctt1+ and ctt1-mut backgrounds are shown. The rectangle and white letterings indicate the _M26_-sequence and mutated bases, respectively. ‘−427’ indicates the position of the mutated base (from ‘T’ to ‘A’), with the first ‘A’ of the ctt1 ORF as 1. Histone H3 and its modification levels were assessed by ChIP as in Figure 1H–J. (B–D) Total histone H3 and histone modification levels around Pctt1+ (filled bars) and Pctt1-mut (open bars) after exposure to H2O2. (B) Levels of Histone H3. (C) Levels of H3K9ac and H3K14ac. (D) Levels of H3K4me3.
Figure 4.
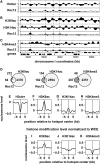
Genome-wide analysis of histone modifications around meiotic recombination hotspots. The pat1-114 cells were induced into meiosis and harvested as in Figure 1. ChIP was performed using anti-histone H3, H3K9ac, H3K14ac and H3K4me3 antibodies, and the resultant DNA was analysed by GeneChip® S. pombe Tiling 1.0FR Array. The pat1-114 rad50S rec12+-FLAG cells were induced into meiosis and harvested 5 h after the induction. ChIP was performed using anti-FLAG antibody, and the resultant DNA was similarly analysed. (A–C) Examples of ChIP-chip data. The _x_-axis shows the chromosomal coordinates in bp, and the _y_-axis shows the log2 of signal strength. The vertical dotted lines indicate Rec12 binding (i.e. DSB) sites. Genes are shown as filled boxes at the bottom of the figure. Comparison between Rec12 binding sites (Rec12) and histone H3 (H3cter; A), acetylated histone H3 (H3K9ac and H3K14ac; B) or trimetylated histone H3K4 (H3K4me3; C). Representative results are shown. Note that the levels of modified histones (B and C) are normalized to those of histone H3. (D) Venn diagrams showing the overlap between Rec12 binding (DSB) sites and modified histones calculated as described in ‘Materials and Methods’ section. (E–K) Distribution of histone H3 (E), H3K9ac (F and I), H3K14ac (G and J) and H3K4me3 (H and K) around meiotic recombination hotspots. The charts were created by a moving average method with a window size of 1 kb and a step size of 0.1 kb. The y axis shows the log2 of signal strength. The lines indicate the average of all hotspots. (F–H) Histone modification levels normalized to histone H3 were presented. (I–K) Histone modification levels normalized to whole-cell extract were presented.
Figure 5.
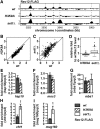
Effects of H3K9A mutation and set1 deletion on Rec12 distribution. (A–D) The pat1-114 rad50S rec12+-FLAG cells in the H3K9A or set1Δ backgrounds were induced into meiosis and analysed as in Figure 4. (A) Examples of ChIP-chip data. The _x_-axis shows the chromosomal coordinates in bp, and the _y_-axis shows the log2 of signal strength. The same chromosomal region with Figure 4A–C is shown. The vertical dotted lines indicate Rec12 binding sites. Representative results are shown. (B and C) Scatter plot comparing Rec12 levels in wild-type (_x_-axis) and the mutant (_y_-axis) based on the maximum signal strength (log2) of each Rec12 binding site. Rec12 binding sites that are present and absent in wild-type cells are shown in black and grey dots, respectively. (B) H3K9A. (C) set1Δ. The positions of mbs1, mbs2 and cds1 are presented in
Supplementary Figure S10E
. (D) Box-and-Whisker plots showing the ratio of Rec12 levels between the mutant and the wild-type, based on their respective maximum signal strengths of Rec12 binding sites present in wild-type cells. (E–I) ChIP-qPCR of Rec12-FLAG in wild-type, H3K9A or set1Δ cells. pat1-114 rad50S rec12+-FLAG cells were induced into meiosis, harvested 5 h after the induction and analysed by ChIP-qPCR using anti-FLAG antibody. (E–G) Hotspots were analysed at hsp10 (E), moc3 (F) and mbs1 (G). (H and I) Rec12 binding sites present only in set1Δ cells were analysed. vht1 (H) and mug160 (I).
Figure 6.
Effects of H3K9A mutation and set1 deletion on meiotic DSB formation. (A, and C–F) The pat1-114 rad50S cells were induced into meiosis and were collected at indicated times after the induction. Genomic DNA was analysed by pulse-field gel electrophoresis (A) or standard gel electrophoresis (C–F). (B) The pat1-114 rec12+-FLAG cells induced into meiosis and were collected at indicated times after the induction. Rec12-FLAG was immunoprecipitated and labelled with TdT and [α-32P]dCTP. (A) Formation of meiotic DSBs at the chromosome level. DNA was visualized with ethidium bromide. The positions of chromosomes I, II, III and smears resulting from meiotic DSBs are shown. Note that the intact chromosomes are present at 4.5 and 5 h in the H3K9A and set1Δ mutants, but not in wild-type cells. The arrowheads indicate the point at which the delay in DSB formation of H3K9A was the most apparent (3.5 h). (B) Production of Rec12-oligonucleotide complexes is defective in the H3K9A and set1Δ mutants. 32P-labelled Rec12-oligonucleotide complex and Rec12 were detected by autoradiography (32P) and western blotting using horseradish peroxidase-conjugated anti-FLAG antibody (anti-FLAG), respectively. (C) An example showing the meiotic DSBs formed at mbs1 and mbs2. DNA digested with Not I restriction endonuclease was analysed by Southern blotting with the c227 probe recognizing the left end of the Not I J fragment. (D) Quantification of the DSBs at mbs1 and mbs2. These values were obtained by dividing the signal intensity of broken DNA fragments over the signal intensity of the unbroken Not I J fragment. The means and standard deviations from three independent experiments are shown. (E) An example showing the meiotic DSBs formed at cds1. DNA digested with Hae II restriction endonuclease was analysed by Southern blotting as described in (25). (F) Quantification of the DSBs at cds1. The experiment was performed twice to check reproducibility, and a representative result is shown.
Similar articles
- The histone variant H2A.Z promotes initiation of meiotic recombination in fission yeast.
Yamada S, Kugou K, Ding DQ, Fujita Y, Hiraoka Y, Murakami H, Ohta K, Yamada T. Yamada S, et al. Nucleic Acids Res. 2018 Jan 25;46(2):609-620. doi: 10.1093/nar/gkx1110. Nucleic Acids Res. 2018. PMID: 29145618 Free PMC article. - Genetic Interactions of Histone Modification Machinery Set1 and PAF1C with the Recombination Complex Rec114-Mer2-Mei4 in the Formation of Meiotic DNA Double-Strand Breaks.
Zhang Y, Suzuki T, Li K, Gothwal SK, Shinohara M, Shinohara A. Zhang Y, et al. Int J Mol Sci. 2020 Apr 12;21(8):2679. doi: 10.3390/ijms21082679. Int J Mol Sci. 2020. PMID: 32290544 Free PMC article. - The PHD finger protein Spp1 has distinct functions in the Set1 and the meiotic DSB formation complexes.
Adam C, Guérois R, Citarella A, Verardi L, Adolphe F, Béneut C, Sommermeyer V, Ramus C, Govin J, Couté Y, Borde V. Adam C, et al. PLoS Genet. 2018 Feb 14;14(2):e1007223. doi: 10.1371/journal.pgen.1007223. eCollection 2018 Feb. PLoS Genet. 2018. PMID: 29444071 Free PMC article. - The conserved histone variant H2A.Z illuminates meiotic recombination initiation.
Yamada S, Kugou K, Ding DQ, Fujita Y, Hiraoka Y, Murakami H, Ohta K, Yamada T. Yamada S, et al. Curr Genet. 2018 Oct;64(5):1015-1019. doi: 10.1007/s00294-018-0825-9. Epub 2018 Mar 16. Curr Genet. 2018. PMID: 29549582 Review. - Regulation Mechanisms of Meiotic Recombination Revealed from the Analysis of a Fission Yeast Recombination Hotspot ade6-M26.
Hirota K. Hirota K. Biomolecules. 2022 Nov 26;12(12):1761. doi: 10.3390/biom12121761. Biomolecules. 2022. PMID: 36551189 Free PMC article. Review.
Cited by
- Deep learning identifies and quantifies recombination hotspot determinants.
Li Y, Chen S, Rapakoulia T, Kuwahara H, Yip KY, Gao X. Li Y, et al. Bioinformatics. 2022 May 13;38(10):2683-2691. doi: 10.1093/bioinformatics/btac234. Bioinformatics. 2022. PMID: 35561158 Free PMC article. - The histone variant H2A.Z promotes initiation of meiotic recombination in fission yeast.
Yamada S, Kugou K, Ding DQ, Fujita Y, Hiraoka Y, Murakami H, Ohta K, Yamada T. Yamada S, et al. Nucleic Acids Res. 2018 Jan 25;46(2):609-620. doi: 10.1093/nar/gkx1110. Nucleic Acids Res. 2018. PMID: 29145618 Free PMC article. - Contrasted patterns of crossover and non-crossover at Arabidopsis thaliana meiotic recombination hotspots.
Drouaud J, Khademian H, Giraut L, Zanni V, Bellalou S, Henderson IR, Falque M, Mézard C. Drouaud J, et al. PLoS Genet. 2013 Nov;9(11):e1003922. doi: 10.1371/journal.pgen.1003922. Epub 2013 Nov 14. PLoS Genet. 2013. PMID: 24244190 Free PMC article. - Physiology of the read-write genome.
Shapiro JA. Shapiro JA. J Physiol. 2014 Jun 1;592(11):2319-41. doi: 10.1113/jphysiol.2014.271130. J Physiol. 2014. PMID: 24882816 Free PMC article. Review. - Epigenetic Marks and Variation of Sequence-Based Information Along Genomic Regions Are Predictive of Recombination Hot/Cold Spots in Saccharomyces cerevisiae.
Liu G, Song S, Zhang Q, Dong B, Sun Y, Liu G, Zhao X. Liu G, et al. Front Genet. 2021 Jun 29;12:705038. doi: 10.3389/fgene.2021.705038. eCollection 2021. Front Genet. 2021. PMID: 34267784 Free PMC article.
References
- Bell O, Tiwari VK, Thoma NH, Schubeler D. Determinants and dynamics of genome accessibility. Nat. Rev. Genet. 2011;12:554–564. - PubMed
- Rando OJ. Global patterns of histone modifications. Curr. Opin. Genet. Dev. 2007;17:94–99. - PubMed
- Keeney S. Spo11 and the Formation of DNA Ddouble-Sstrand Breaks in Meiosis. Germany: Springer-Verlag, Heidelberg; 2007.
- Lichten M. Meiotic Chromatin: The Substrate for Recombination Initiation. Berlin: Springer-Verlag; 2008.
Publication types
MeSH terms
Substances
LinkOut - more resources
Full Text Sources
Other Literature Sources
Molecular Biology Databases


