Replication stress links structural and numerical cancer chromosomal instability - PubMed (original) (raw)
. 2013 Feb 28;494(7438):492-496.
doi: 10.1038/nature11935.
Sarah E McClelland # 1, David Endesfelder 1 2, Petra Groth 3, Marie-Christine Weller 3, Nadeem Shaikh 1, Enric Domingo 4, Nnennaya Kanu 1, Sally M Dewhurst 1, Eva Gronroos 1, Su Kit Chew 1 5, Andrew J Rowan 1, Arne Schenk 2, Michal Sheffer 6, Michael Howell 1, Maik Kschischo 2, Axel Behrens 1, Thomas Helleday 3, Jiri Bartek 7 8, Ian P Tomlinson 4, Charles Swanton 1 5
Affiliations
- PMID: 23446422
- PMCID: PMC4636055
- DOI: 10.1038/nature11935
Replication stress links structural and numerical cancer chromosomal instability
Rebecca A Burrell et al. Nature. 2013.
Erratum in
- Nature. 2013 Aug 22;500(7463):490
Abstract
Cancer chromosomal instability (CIN) results in an increased rate of change of chromosome number and structure and generates intratumour heterogeneity. CIN is observed in most solid tumours and is associated with both poor prognosis and drug resistance. Understanding a mechanistic basis for CIN is therefore paramount. Here we find evidence for impaired replication fork progression and increased DNA replication stress in CIN(+) colorectal cancer (CRC) cells relative to CIN(-) CRC cells, with structural chromosome abnormalities precipitating chromosome missegregation in mitosis. We identify three new CIN-suppressor genes (PIGN (also known as MCD4), MEX3C (RKHD2) and ZNF516 (KIAA0222)) encoded on chromosome 18q that are subject to frequent copy number loss in CIN(+) CRC. Chromosome 18q loss was temporally associated with aneuploidy onset at the adenoma-carcinoma transition. CIN-suppressor gene silencing leads to DNA replication stress, structural chromosome abnormalities and chromosome missegregation. Supplementing cells with nucleosides, to alleviate replication-associated damage, reduces the frequency of chromosome segregation errors after CIN-suppressor gene silencing, and attenuates segregation errors and DNA damage in CIN(+) cells. These data implicate a central role for replication stress in the generation of structural and numerical CIN, which may inform new therapeutic approaches to limit intratumour heterogeneity.
Figures
Figure 1. Replication stress generates chromosome segregation errors in CIN+ cells
a) Schematic illustrating pre-mitotic and mitotic origins of chromosome segregation errors. Right panels: example images in SW1116 (CIN+) cells stained with DAPI and anti-centromere antibodies (ACA). b) % Segregation errors in CIN+ cell lines classified into lagging chromosomes, acentrics and anaphase bridges. Bridges extend fully between DNA masses; acentrics and lagging chromosomes were distinguished using ACA staining. Segregation errors not classifiable as bridges, lagging chromosomes or acentrics (<15%) are omitted for clarity. % Anaphases displaying segregation errors (n>100/cell line), and % metaphases displaying structural aberrations (n=38-84/cell line) shown below graph. c) Examples of structurally abnormal chromosomes identified on metaphase chromosome spreads, hybridised to an all-centromere probe (green) and stained with DAPI. d) Examples of replication stress-associated cellular phenotypes in NCIH747 (CIN+) cells stained with DAPI and antibodies as indicated; (i) γH2AX foci in prometaphase; (ii) 53BP1 bodies in G1 (cyclin A1-negative) cells; (iii) anaphase UFBs, detected with antibodies for the single-stranded DNA binding protein RPA. e) % Prometaphase DNA damage in CIN+ versus CIN− cells (n>100 cells/cell line, *p=0.033). f) % G1 53BP1 bodies in CIN+ versus CIN− cells (n>250 cells/cell line, *p=0.028). g) % Anaphases with UFBs. h,i) 4 CIN+ and 2 CIN− cell lines were incubated sequentially with 5-chlorodeoxyuridine (CldU) and 5-iododeoxyuridine (IdU) for 30 minutes each. DNA fibre assays were performed and replication rates at individual replication forks were assessed. Representative fibres from each cell line are shown (h). i) Distribution of replication fork rates (CldU, n>300 forks in total/cell line from 3 experiments), with mean replication fork rates (CldU, n>60 forks/experiment, mean±s.e.m of 3 experiments) shown in the key (inset). Two-tailed t-test relative to HCT-116 cells.
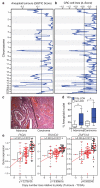
Figure 2. Somatic copy number loss of chromosome 18q in CIN+ CRC
a) GISTIC analysis for somatic copy number loss in 26 aneuploid colorectal tumours. Q=0.25 determines significance (black line). b) Copy number losses in 20 CIN+ CRC cell lines. Significant regions were defined relative to 9 CIN− cell lines, (Q=0.25, black line). c) Haematoxylin and eosin-stained tumour specimen, showing adenoma with adjacent carcinoma. d) % Aneuploid nuclei, measured by DNA image cytometry, in paired adenomas and carcinomas (n=20) with/without 18q LOH (Tukey box plot with outliers displayed, two-tailed t-test, *p<0.05). **e)** Spearman’s rank correlation between mRNA expression and DNA copy number for _PIGN_, _RKHD2_ and _ZNF516_ in CIN− (n=28, black dots) versus CIN+ (n=74, red dots) tumours (TCGA). Tumours were defined as CIN+ based on a weighted genome integrity index >0.2 (see Methods). Statistic: Wilcoxon Mann-Whitney test.
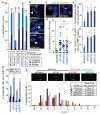
Figure 3. Candidate suppressors of replication stress and CIN encoded on chromosome 18q
a,b) CIN-suppressor genes were silenced in HCT-116 (CIN−) cells for 48 h. a) % Segregation errors accounted for by lagging chromosomes, acentrics and anaphase bridges. Other segregation errors (<15%) are omitted for clarity**.** For comparison, segregation errors arising via improper chromosome attachments were induced by monastrol treatment (100 μM, 1 h, 75 min release). % Anaphases displaying segregation errors and % metaphases displaying ≥1 structurally abnormal chromosome (n>100) shown below graph. b) Examples of structurally abnormal chromosomes as indicated. c,d) Cell lines stably expressing shRNAs as indicated were seeded at low density on glass slides to allow colony formation. Slides were fixed and hybridised to DNA probes for centromeres 2 and 15. c) Example images of control and shPIGN cells. d) % Deviation from the modal centromere copy number per colony (mean of two probes (CEP2 and CEP15)). Lines are median values, statistic: Dunn’s Multiple Comparison test, p<0.01. **e-g)** HCT-116 cells were scored for replication stress-associated phenotypes following siRNA-mediated CIN− suppressor gene silencing: **e)** % Prometaphases exhibiting ≥3 γH2AX foci (mean±s.e.m, 3 experiments, n>100/experiment); f) % G1 cells with ≥3 53BP1 bodies (mean±s.e.m, 3 experiments, n>150/experiment); g) % Anaphases with UFBs (mean±s.e.m, 3 experiments, n=100/experiment). Statistical tests for e-g) were two-tailed t-tests, *p<0.05, **p<0.01. **h,i)** DNA fibre assays were performed following siRNA transfection as indicated. Representative fibre images for siRNA transfections as indicated as shown **(h)**. **i)** Distribution of replication fork rates (n>200 forks in total per siRNA transfection from 2 experiments) with mean fork rates (n>70 forks/experiment, mean±s.d of 2 experiments) shown in the key (inset).
Figure 4. Nucleoside supplementation reduces segregation error frequency and prometaphase DNA damage
a) % Anaphases with segregation errors ± 48 h nucleoside supplementation 24 h after siRNA transfection as indicated (mean±s.e.m, 3 experiments, Two-tailed t-test, **p<0.01). b) % Anaphases with segregation errors ± 48 h nucleoside supplementation in CIN+ cell lines as indicated (mean±s.e.m, 3 experiments, Two-tailed t-test, **p<0.01). c) Fold change in % prometaphases exhibiting ≥3 γH2AX foci ± 48 h nucleoside supplementation in CIN+ cell lines as indicated (n≥100 cells per condition per cell line, mean±s.e.m of 3 experiments). Un-normalised data is shown in Supplementary 13a.
Comment in
- Cancer: Stress mixes chromosomes.
Janssen A, Medema RH. Janssen A, et al. Nature. 2013 Feb 28;494(7438):439-41. doi: 10.1038/494439a. Nature. 2013. PMID: 23446415 No abstract available.
Similar articles
- DNA Replication Stress and Chromosomal Instability: Dangerous Liaisons.
Wilhelm T, Said M, Naim V. Wilhelm T, et al. Genes (Basel). 2020 Jun 10;11(6):642. doi: 10.3390/genes11060642. Genes (Basel). 2020. PMID: 32532049 Free PMC article. Review. - Mild replication stress causes aneuploidy by deregulating microtubule dynamics in mitosis.
Böhly N, Kistner M, Bastians H. Böhly N, et al. Cell Cycle. 2019 Oct;18(20):2770-2783. doi: 10.1080/15384101.2019.1658477. Epub 2019 Aug 25. Cell Cycle. 2019. PMID: 31448675 Free PMC article. - Increased replication origin firing links replication stress to whole chromosomal instability in human cancer.
Böhly N, Schmidt AK, Zhang X, Slusarenko BO, Hennecke M, Kschischo M, Bastians H. Böhly N, et al. Cell Rep. 2022 Dec 13;41(11):111836. doi: 10.1016/j.celrep.2022.111836. Cell Rep. 2022. PMID: 36516748 - Chromosomal instability: A common feature and a therapeutic target of cancer.
Tanaka K, Hirota T. Tanaka K, et al. Biochim Biophys Acta. 2016 Aug;1866(1):64-75. doi: 10.1016/j.bbcan.2016.06.002. Epub 2016 Jun 21. Biochim Biophys Acta. 2016. PMID: 27345585 Review.
Cited by
- Telomerase abrogates aneuploidy-induced telomere replication stress, senescence and cell depletion.
Meena JK, Cerutti A, Beichler C, Morita Y, Bruhn C, Kumar M, Kraus JM, Speicher MR, Wang ZQ, Kestler HA, d'Adda di Fagagna F, Günes C, Rudolph KL. Meena JK, et al. EMBO J. 2015 May 12;34(10):1371-84. doi: 10.15252/embj.201490070. Epub 2015 Mar 27. EMBO J. 2015. PMID: 25820263 Free PMC article. - Tracking the genomic evolution of esophageal adenocarcinoma through neoadjuvant chemotherapy.
Murugaesu N, Wilson GA, Birkbak NJ, Watkins T, McGranahan N, Kumar S, Abbassi-Ghadi N, Salm M, Mitter R, Horswell S, Rowan A, Phillimore B, Biggs J, Begum S, Matthews N, Hochhauser D, Hanna GB, Swanton C. Murugaesu N, et al. Cancer Discov. 2015 Aug;5(8):821-831. doi: 10.1158/2159-8290.CD-15-0412. Epub 2015 May 23. Cancer Discov. 2015. PMID: 26003801 Free PMC article. - Single-Cell Based Quantitative Assay of Chromosome Transmission Fidelity.
Zhu J, Heinecke D, Mulla WA, Bradford WD, Rubinstein B, Box A, Haug JS, Li R. Zhu J, et al. G3 (Bethesda). 2015 Mar 30;5(6):1043-56. doi: 10.1534/g3.115.017913. G3 (Bethesda). 2015. PMID: 25823586 Free PMC article. - Genomic and transcriptomic profiling of combined small-cell lung cancer through microdissection: unveiling the transformational pathway of mixed subtype.
Ma W, Zhou T, Song M, Liu J, Chen G, Zhan J, Ji L, Luo F, Gao X, Li P, Xia X, Huang Y, Zhang L. Ma W, et al. J Transl Med. 2024 Feb 21;22(1):189. doi: 10.1186/s12967-024-04968-4. J Transl Med. 2024. PMID: 38383412 Free PMC article. - Exploiting Chromosomal Instability of PTEN-Deficient Triple-Negative Breast Cancer Cell Lines for the Sensitization against PARP1 Inhibition in a Replication-Dependent Manner.
Rieckhoff J, Meyer F, Classen S, Zielinski A, Riepen B, Wikman H, Petersen C, Rothkamm K, Borgmann K, Parplys AC. Rieckhoff J, et al. Cancers (Basel). 2020 Sep 29;12(10):2809. doi: 10.3390/cancers12102809. Cancers (Basel). 2020. PMID: 33003585 Free PMC article.
References
- Lengauer C, Kinzler KW, Vogelstein B. Genetic instabilities in human cancers. Nature. 1998;396:643–649. doi:10.1038/25292. - PubMed
Additional references
- Cesare AJ, et al. Spontaneous occurrence of telomeric DNA damage response in the absence of chromosome fusions. Nat Struct Mol Biol. 2009;16:1244–1251. doi:10.1038/nsmb.1725. - PubMed
- Groth P, et al. Methylated DNA causes a physical block to replication forks independently of damage signalling, O(6)-methylguanine or DNA single-strand breaks and results in DNA damage. J Mol Biol. 2010;402:70–82. doi:S0022-2836(10)00763-1 [pii] 10.1016/j.jmb.2010.07.010. - PubMed
Publication types
MeSH terms
Substances
Grants and funding
- A4688/CRUK_/Cancer Research UK/United Kingdom
- A19310/CRUK_/Cancer Research UK/United Kingdom
- MRC_/Medical Research Council/United Kingdom
- 090532/WT_/Wellcome Trust/United Kingdom
- 15679/CRUK_/Cancer Research UK/United Kingdom
- A17786/CRUK_/Cancer Research UK/United Kingdom
- A11590/CRUK_/Cancer Research UK/United Kingdom
- 16459/CRUK_/Cancer Research UK/United Kingdom
LinkOut - more resources
Full Text Sources
Other Literature Sources
Medical
Molecular Biology Databases
Miscellaneous


