Impaired autophagy, defective T cell homeostasis, and a wasting syndrome in mice with a T cell-specific deletion of Vps34 - PubMed (original) (raw)
Impaired autophagy, defective T cell homeostasis, and a wasting syndrome in mice with a T cell-specific deletion of Vps34
Vrajesh V Parekh et al. J Immunol. 2013.
Abstract
Autophagy plays a critical role in multiple aspects of the immune system, including the development and function of T lymphocytes. In mammalian cells, the class III PI3K vacuolar protein sorting (Vps)34 is thought to play a critical role in autophagy. However, recent studies have cast doubt on the role of Vps34 in autophagy, at least in certain cell types. To study the effects of Vps34 on autophagy in T lymphocytes, we generated mice that selectively lack Vps34 in the T cell lineage. Vps34 ablation in T cells caused profound defects in autophagic flux, resulting in accumulation of cellular organelles and apoptosis. These animals exhibited normal intrathymic development of conventional T cells, but they were profoundly impaired in the intrathymic development of invariant NKT cells. In peripheral organs, T cell-specific ablation of Vps34 had a profound impact on T cell homeostasis and function. Furthermore, aged animals developed an inflammatory wasting syndrome characterized by weight loss, intestinal inflammation, and anemia. Consistent with this phenotype, Vps34 was required for the peripheral maintenance and function of CD4(+)Foxp3(+) regulatory T cells. Collectively, our study reveals a critical role for Vps34 in autophagy and for the peripheral homeostasis and function of T lymphocytes.
Conflict of interest statement
Disclosures
The authors have no financial conflicts of interest.
Figures
FIGURE 1
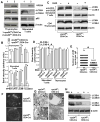
Vps34-deficient T cells display defective autophagy. (A) CD4+ thymocytes or total T cells were purified from 6- to 8-week-old Vps34f/f;CD4-Cre or Vps34f/+;CD4-Cre mice using magnetic sorting. Proteins were prepared from CD4+ thymocytes or from anti-CD3/CD28 stimulated T cells for immunoblot analysis with antibodies against Vps34, p62, LC3B or β-actin. Representative data from three independent experiments are shown. (B) Densitometric analysis of protein bands obtained in (A). Data are from an average of 4 mice from 3 independent experiments. *p<0.05. (_C_) Autophagic flux assay was performed by culture of CD4+ thymocytes or activated T cells in the absence or presence of E64D (10 μg/ml) plus pepstatin A (10 μg/ml) for 90 min, followed by immunoblot analysis with the anti-LC3B antibody. (_D_) Densitometric analysis of protein bands obtained in (_C_). Data are from an average of 4 mice from 3 independent experiments. *p<0.05. (_E_) Purified total T cells were stained with the anti-LC3B and Cy3-labeled donkey anti-mouse antibodies. Z-stack images were captured and spaced at 1 μm using confocal microscopy and a total of 30–35 cells in each group were analyzed. The number of LC3 punctae was quantified at a threshold set at pixels >4. *p<0.05. (F) A representative image from (E) is shown. (G) Activated T cells were stained with anti-LC3B antibodies followed by anti-rabbit antibodies labeled with 10 nm gold particles. The cells were embedded, sectioned and stained with uranyl acetate and lead citrate followed by analysis with a Philips/FEI T-12 transmission electron microscope. Note the predominant staining of LC3B associated with autophagosomes (staining indicated with arrows) in Vps34f/+;CD4-Cre T cells (scale bar=100nm) (upper panel), while increased cytosolic staining is observed in Vps34f/f;CD4-Cre T cells (scale bar=500nm) (upper panel). Controls with secondary antibody alone rarely showed gold staining in T cells from either Vps34f/f;CD4-Cre or Vps34f/+;CD4-Cre mice (scale bar=500nm) (lower panel). Note in the control image of T cells derived from Vps34f/f;CD4-Cre mice that cellular organelles accumulate and are clumped together due to defective autophagy. (H) T cells were enriched and activated as in (A). The cells were treated with 3-MA (5 mM) for the last 5 hours of culture, followed by immunoblot analysis with anti-LC3B antibody. Blots with high (upper panel) or low (lower panel) exposure time are shown. The data are representative of 3 independent experiments with similar results.
FIGURE 2
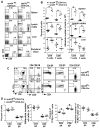
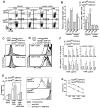
Frequency of T cells in T cell-specific Vps34-deficient mice. (A) The frequency of CD4+ T cells and CD8+ T cells was analyzed in spleen, lymph nodes, liver and peripheral blood after live cell gating by flow cytometry. (B) Summary of the frequency of CD4+ and CD8+ T cells as shown in (A) and their absolute numbers calculated based on the organ cellularity with 5–6 mice analyzed in each group. *p<0.05. (C) Thymocytes were stained with anti-CD4 and -CD8 antibodies and double negative (DN) cells were analyzed using anti-CD44 and -CD25 antibodies. Positively selected cells were identified by the expression of TCRβ and loss of CD24 on T cells gated on CD4 single-positive (SP), CD8 SP and CD4 CD8 double-positive (DP) cells. (D) Summary of the frequency and absolute numbers from (C) is shown with 5–6 mice analyzed per group and from at least 3 independent experiments. *p<0.05.
FIGURE 3
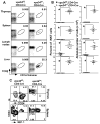
iNKT cells in T cell-specific Vps34-deficient mice. (A) Splenic, lymph node, thymic and liver mononuclear cells were prepared from Vps34f/f;CD4-Cre or Vps34f/+;CD4-Cre mice and were stained with anti-TCR-β, CD1d-tetramer and anti-B220 antibodies. (B) Frequency of iNKT cells in various lymphoid organs with 5–6 mice analyzed in each group from at least 3 independent experiments. *p<0.05. (C) Thymic iNKT cells were stained with CD1d-tetramer, and anti-CD8, -CD44 and -CD24 antibodies. Cells gated on tetramer+CD8α− cells are shown. For splenic iNKT cell analysis, B220+ cells were excluded from the analysis. A representative experiment of 3 independent experiments is shown.
FIGURE 4
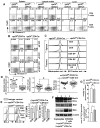
Apoptosis and cellular organelles in Vps34-deficient T cells. (A,B) Splenic (A), lymph node (A), liver (A) or thymic (B) mononuclear cells were prepared from Vps34f/f;CD4-Cre or Vps34f/+;CD4-Cre mice and were stained with anti-CD4 and -CD8 antibodies, 7-AAD and Annexin V. Annexin V+7-AAD− cells were considered early apoptotic cells and annexin V+7-AAD+ cells were considered late apoptotic cells. A representative of 4 independent experiments is shown. The average ± SEM of 6 mice is shown. A summary of these results is shown in Supplemental Fig. 2_B_. (C) Splenocytes or thymocytes were stained with MitoTracker® Red (50 nM) or ER-Tracker™ red (1 μM) at 37°C for 30 min in complete medium followed by surface staining with anti-CD4 and -CD8 antibodies at 4°C. The data shown are gated on splenic CD4+ or CD8+ T cells or thymic CD4 SP, CD8 SP or CD4 CD8 DP cells. A representative of 3 independent experiments is shown. (D) Absolute number of mitochondria and the total size of the mitochondria were determined in activated T cells using transmission electron microscopy. The Image J software was used to manually mark single mitochondria, measuring their surface area, and normalization against the scale bar from transmission electron microscopy images. The data presented are the total size of all the mitochondria or nucleus (as negative control) normalized against the size of the cell. A representative from 30–35 individually imaged cells in each group is shown to the bottom. Scale bar = 500 nm. *p<0.05. (E) Splenocytes derived from Vps34f/f;CD4-Cre or Vps34f/+;CD4-Cre mice were stained with anti-CD4 and -CD8 antibodies followed by intracellular staining with anti-Bcl-2 or -Bcl-xL antibodies or their respective isotype controls. The data shown are gated on CD4+ or CD8+ T cells. A representative experiment of 3 individual experiments is shown to the left and the average ± SEM of 4 mice is summarized. (F) T cells were activated as described in the legend to Fig. 1 and subjected to immunoblot analysis with anti-Bim, -Bad or -Bax antibodies. (G) The rate of glycolysis was measured in activated T cells by incubating 106 cells with ten μCi of 5-[3H] glucose for 1 hr in RPMI medium. The rate of β-oxidation was measured by culture of 4×10⁶ activated T cells in 0.4 ml of RPMI containing 2 μCi 9,10-[3H] palmitate (MP), 2% of BSA (fatty acid free) and 0.25 mM L-carnitine for 4 hrs.
FIGURE 5
Homeostatic markers and proliferation of T cells in response to TCR engagement. (A) Splenocytes and lymph node cells derived from Vps34f/f;CD4-Cre or Vps34f/+;CD4-Cre mice were stained with anti-CD44, -CD62L, -CD4 and -CD8 antibodies. The data shown are gated on CD4+ or CD8+ T cells. (B) Summary of results obtained in (A). The average ± SEM of 6 mice is shown. (C) Splenocytes were stained with anti-CD4-PerCP and -CD8-APC antibodies followed by intracellular staining with anti-Ki67 antibody. The data shown are gated on CD4+ or CD8+ T cells. A representative experiment of 3 individual experiments is shown. (D) Splenocytes from Vps34f/f;CD4-Cre or Vps34f/+;CD4-Cremice were labeled with the CFSE dye and 3×10⁵ cells/well were activated with anti-CD3 antibody (1 μg/ml) for 60 hrs. Cells were stained with anti-CD4 and -CD8 antibodies and CFSE dilution analysis was performed on the respective T cell subset. (E) CFSE-labeled cells were cultured as in (D) with or without z-VAD-fmk (20 μM). The percentage total apoptotic cells was measured (left) as described in the legend of Fig. 4 and CFSE dilution analysis was performed on CD4+ T cells. A representative experiment of 3 individual experiments is shown. (F) Vps34f/f;CD4-Cre or Vps34f/+;CD4-Cre mice were immunized with ovalbumin (OVA). The mice were sacrificed at day 15 and splenic and draining lymph node cells were stimulated in vitro with 100 μg/ml of OVA. The supernatants were collected at 72 hrs of culture and assayed for IL-17A and IFN-γ by ELISA. (G) Total serum IgG derived from Vps34f/f;CD4-Cre or Vps34f/+;CD4-Cre mice was measured by ELISA. The average ± SEM of 4 mice is shown.
FIGURE 6
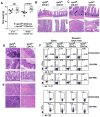
Development of a wasting disease in T cell-specific Vps34-deficient mice. (A) Absolute weights of mice in 6- to 12-week-old or 18- to 25-week-old mice. (B) H&E staining of small intestinal sections from Vps34f/f;CD4-Cre or Vps34f/+;CD4-Cre mice depicting intestinal villus blunting and fusion (arrows), and inflammatory infiltrates (*) in the lamina propria consisting of neutrophils, lymphocytes, plasma cells, and macrophages in Vps34f/f;CD4-Cre mice (magnification: upper panels, 20x; lower panels, 60x). (C) Top panels depict H&E staining of small intestinal sections (magnification: 40x) showing hyperplastic crypts in the Vps34f/f;CD4-Cre mice with crowded nuclei and increased mitosis (arrows) while few scattered mitotic cells were observed in the Vps34f/+;CD4-Cre mice. Lower panels (magnification: 4x) depict adenomas in the anterior duodenum of Vps34f/f;CD4-Cre mice. (D) H&E staining of colon sections showing increased lymphoid follicles in the mucosa of Vps34f/f;CD4-Cre mice (upper and middle panels: 20x magnification, bottom panels: 40x magnification) with mild infiltrates of neutrophils, lymphocytes and plasma cells (arrows) in the lamina propria of the distal colon. (E) H&E staining of splenic sections showing expanded red pulp area due to extramedullary erythropoiesis (*) in Vps34f/f;CD4-Cre mice (magnification: upper panels: 20x, lower panels, 40x). (F) Splenic and mesenteric lymph node mononuclear cells from 18- to 25-week-old mice were prepared and 2×10⁵ cells were activated with PMA and ionomycin (ION+PMA) in the presence of GolgiPlug™ to allow intracellular accumulation of cytokines. Cells were then harvested and surface-stained with anti-CD4 and -CD8 antibodies, followed by intracellular staining with anti-IL-17A and anti-IFN-γ antibodies, or with anti-IL-13 and anti-IFN-γ antibodies. The data shown are gated on CD4+ or CD8+ T cells. Results shown are representative of 3 individual experiments and 6 mice in each group.
FIGURE 7
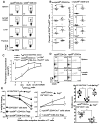
CD4+FoxP3+ Treg cells in T cell-specific Vps34-deficient mice. (A) Splenic, lymph node, thymic and liver mononuclear cells were prepared from Vps34f/f;CD4-Cre or Vps34f/+;CD4-Cre mice and were stained with anti-CD4, -CD8 and -CD25 antibodies followed by intracellular staining with anti-FoxP3 antibody. Data shown are for cells gated on CD4+ T cells or CD4 SP thymocytes. (B) Summary of the frequency of CD4+FoxP3+ T cells and their absolute numbers calculated based on the organ cellularity with 5–6 mice analyzed in each group. *p<0.05. (C) Two × 105 CD4+CD25− T effector (Teff) cells were activated with anti-CD3ε antibody (1 μg/ml) and 2×10⁴ DCs in the presence of Treg cells purified from splenic CD4+ T cells derived from Vps34f/f;CD4-Cre or Vps34f/+;CD4-Cre mice at various Teff to Treg cell ratios for 60 hrs with the addition of 1μCi of [3H]thymidine for the last 12 hrs of culture. *p<0.05. (D) Splenic and lymph node cells were stained as in (A) and data are shown for cells gated on CD4+ T cells. Results shown are representative of 3 individual experiments and 6 mice in each group. (E, F) CD4+CD25− cells (2×10⁶ cells) derived from Vps34f/f;CD4-Cre or Vps34f/+;CD4-Cre mice were adoptively transferred into Rag2−/− mice to induce colitis. Groups of mice were co-transferred with 5×10⁵ CD4+CD25+ Treg cells derived from Vps34f/f;CD4-Cre or Vps34f/+;CD4-Cre mice. The mice were followed for 12 weeks for weight loss and signs of colitis. The data shown are the average ± SEM of 6 mice pooled from two experiments. Representative histology pictures from each group are shown in Supplemental Fig. 4_B_.
Similar articles
- Canonical autophagy dependent on the class III phosphoinositide-3 kinase Vps34 is required for naive T-cell homeostasis.
Willinger T, Flavell RA. Willinger T, et al. Proc Natl Acad Sci U S A. 2012 May 29;109(22):8670-5. doi: 10.1073/pnas.1205305109. Epub 2012 May 16. Proc Natl Acad Sci U S A. 2012. PMID: 22592798 Free PMC article. - Autophagy-related protein Vps34 controls the homeostasis and function of antigen cross-presenting CD8α+ dendritic cells.
Parekh VV, Pabbisetty SK, Wu L, Sebzda E, Martinez J, Zhang J, Van Kaer L. Parekh VV, et al. Proc Natl Acad Sci U S A. 2017 Aug 1;114(31):E6371-E6380. doi: 10.1073/pnas.1706504114. Epub 2017 Jul 17. Proc Natl Acad Sci U S A. 2017. PMID: 28716903 Free PMC article. - Lack of phosphatidylinositol 3-kinase VPS34 in regulatory T cells leads to a fatal lymphoproliferative disorder without affecting their development.
Courreges CJF, Davenport ECM, Bilanges B, Rebollo-Gomez E, Hukelmann J, Schoenfelder P, Edgar JR, Sansom D, Scudamore CL, Roychoudhuri R, Garden OA, Vanhaesebroeck B, Okkenhaug K. Courreges CJF, et al. Front Immunol. 2024 Nov 27;15:1374621. doi: 10.3389/fimmu.2024.1374621. eCollection 2024. Front Immunol. 2024. PMID: 39664390 Free PMC article. - Class III Phosphatidylinositol-3 Kinase/Vacuolar Protein Sorting 34 in Cardiovascular Health and Disease.
Shen Y, Gleghorn JP. Shen Y, et al. J Cardiovasc Transl Res. 2025 Apr;18(2):392-407. doi: 10.1007/s12265-024-10581-z. Epub 2025 Jan 16. J Cardiovasc Transl Res. 2025. PMID: 39821606 Free PMC article. Review. - Targeting VPS34 in autophagy: An update on pharmacological small-molecule compounds.
Liu Y, Yang Q, Chen S, Li Z, Fu L. Liu Y, et al. Eur J Med Chem. 2023 Aug 5;256:115467. doi: 10.1016/j.ejmech.2023.115467. Epub 2023 May 6. Eur J Med Chem. 2023. PMID: 37178482 Review.
Cited by
- Notch1 regulated autophagy controls survival and suppressor activity of activated murine T-regulatory cells.
Marcel N, Sarin A. Marcel N, et al. Elife. 2016 Jun 6;5:e14023. doi: 10.7554/eLife.14023. Elife. 2016. PMID: 27267497 Free PMC article. - PI3K Isoforms in B Cells.
Deenick EK, Bier J, Lau A. Deenick EK, et al. Curr Top Microbiol Immunol. 2022;436:235-254. doi: 10.1007/978-3-031-06566-8_10. Curr Top Microbiol Immunol. 2022. PMID: 36243847 - CD4 T cell autophagy is integral to memory maintenance.
Murera D, Arbogast F, Arnold J, Bouis D, Muller S, Gros F. Murera D, et al. Sci Rep. 2018 Apr 13;8(1):5951. doi: 10.1038/s41598-018-23993-0. Sci Rep. 2018. PMID: 29654322 Free PMC article. - Natural Killer T Cells: An Ecological Evolutionary Developmental Biology Perspective.
Kumar A, Suryadevara N, Hill TM, Bezbradica JS, Van Kaer L, Joyce S. Kumar A, et al. Front Immunol. 2017 Dec 22;8:1858. doi: 10.3389/fimmu.2017.01858. eCollection 2017. Front Immunol. 2017. PMID: 29312339 Free PMC article. Review. - ZFP91 is required for the maintenance of regulatory T cell homeostasis and function.
Wang A, Ding L, Wu Z, Ding R, Teng XL, Wang F, Hu Z, Chen L, Yu X, Zou Q. Wang A, et al. J Exp Med. 2021 Feb 1;218(2):e20201217. doi: 10.1084/jem.20201217. J Exp Med. 2021. PMID: 33355624 Free PMC article.
References
- Xue L, Fletcher GC, Tolkovsky AM. Autophagy is activated by apoptotic signalling in sympathetic neurons: an alternative mechanism of death execution. Mol Cell Neurosci. 1999;14:180–198. - PubMed
- Bursch W. The autophagosomal-lysosomal compartment in programmed cell death. Cell Death Differ. 2001;8:569–581. - PubMed
- Fengsrud M, Erichsen ES, Berg TO, Raiborg C, Seglen PO. Ultrastructural characterization of the delimiting membranes of isolated autophagosomes and amphisomes by freeze-fracture electron microscopy. Eur J Cell Biol. 2000;79:871–882. - PubMed
- Munz C. Enhancing immunity through autophagy. Annu Rev Immunol. 2009;27:423–449. - PubMed
Publication types
MeSH terms
Substances
Grants and funding
- R01 DK081536/DK/NIDDK NIH HHS/United States
- P30 DK058404/DK/NIDDK NIH HHS/United States
- F32 AI102568/AI/NIAID NIH HHS/United States
- R01 AI070305/AI/NIAID NIH HHS/United States
- AI070305/AI/NIAID NIH HHS/United States
- R01 HL089667/HL/NHLBI NIH HHS/United States
- NS064090/NS/NINDS NIH HHS/United States
- R01 NS044044/NS/NINDS NIH HHS/United States
- P30DK058404/DK/NIDDK NIH HHS/United States
- DK081536/DK/NIDDK NIH HHS/United States
- R01 CA129536/CA/NCI NIH HHS/United States
- HL089667/HL/NHLBI NIH HHS/United States
- CA129536/CA/NCI NIH HHS/United States
- R01 GM097355/GM/NIGMS NIH HHS/United States
- R01 NS064090/NS/NINDS NIH HHS/United States
- GM97355/GM/NIGMS NIH HHS/United States
LinkOut - more resources
Full Text Sources
Other Literature Sources
Molecular Biology Databases
Research Materials
Miscellaneous
