Exenatide promotes cognitive enhancement and positive brain metabolic changes in PS1-KI mice but has no effects in 3xTg-AD animals - PubMed (original) (raw)
Exenatide promotes cognitive enhancement and positive brain metabolic changes in PS1-KI mice but has no effects in 3xTg-AD animals
M Bomba et al. Cell Death Dis. 2013.
Abstract
Recent studies have shown that type 2 diabetes mellitus (T2DM) is a risk factor for cognitive dysfunction or dementia. Insulin resistance is often associated with T2DM and can induce defective insulin signaling in the central nervous system as well as increase the risk of cognitive impairment in the elderly. Glucagone like peptide-1 (GLP-1) is an incretin hormone and, like GLP-1 analogs, stimulates insulin secretion and has been employed in the treatment of T2DM. GLP-1 and GLP-1 analogs also enhance synaptic plasticity and counteract cognitive deficits in mouse models of neuronal dysfunction and/or degeneration. In this study, we investigated the potential neuroprotective effects of long-term treatment with exenatide, a GLP-1 analog, in two animal models of neuronal dysfunction: the PS1-KI and 3xTg-AD mice. We found that exenatide promoted beneficial effects on short- and long-term memory performances in PS1-KI but not in 3xTg-AD animals. In PS1-KI mice, the drug increased brain lactate dehydrogenase activity leading to a net increase in lactate levels, while no effects were observed on mitochondrial respiration. On the contrary, exenatide had no effects on brain metabolism of 3xTg-AD mice. In summary, our data indicate that exenatide improves cognition in PS1-KI mice, an effect likely driven by increasing the brain anaerobic glycolysis rate.
Figures
Figure 1
Exenatide effects on body weight of PS1-KI and 3xTg-AD mice. Graphs depict time-course of body weight changes monitored in treated and untreated PS1-KI and 3xTg-AD mice. Untreated genotypes showed a physiological time-dependent gain in weight. 3xTg-AD mice gained significantly more weight (P<0.050) compared with PS1-KI animals when growing from 5–7 month of age. Exenatide treatment did not affect body weigh in both genotypes. Data are presented as mean values±the standard error of the mean (S.E.M.). ‘*' indicates significant differences (P<0.050) between the two genotypes
Figure 2
Effects of exenatide on short- and long-term memory in PS1-KI and 3xTg-AD mice. Memory performances were evaluated with the MWM test. Bar graphs depict: (a) Short-term memory performance, as assessed with time latencies of MWM, performed 1.5 h after the last training session, in treated and untreated 6- and 12 m.o.a. PS1-KI and 3xTg-AD mice. Analysis reveals statistically significant decrease in latency values compared with age-matched untreated mice (*_P_=0.048) only for the 6 m.o.a. PS1-KI animals. No positive effects were seen in 6- and 12 m.o.a. 3xTg-AD mice. (b) Long-term memory performance, as assessed with time latencies of MWM, performed 24 h after the last training session, in treated and untreated PS1-KI and 3xTg-AD mice. Analysis of 6 m.o.a. exenatide-treated mice showed statistically significant decrease in latency values compared with age-matched untreated mice (*_P_=0.026) only in PS1-KI animals. No positive effects were seen in 3xTg-AD mice. (c) Short-term memory and (d) long-term memory performances, as assessed with platform crosses of MWM, performed 1.5 h or 24 h, after the last training session, in treated and untreated 6 and 12 m.o. PS1-KI and 3xTg-AD mice. Analysis showed statistically significant decrease in the number of platform crosses at 1.5 h in untreated 12 m.o.a. 3xTg-AD compared with age-matched untreated PS1-KI mice (*_P_=0.002). (e) Short-term memory and (f) long-term memory performances, as assessed with T target of MWM, performed at 1.5 h and 24 h, in treated and untreated PS1-KI and 3xTg-AD mice. Analysis showed statistically significant decrease in time spent in the T target at 1.5 h (_P_=0.00002) and 24 h (_P_=0.00007) in untreated and treated 6- and 12 m.o.a. 3xTg-AD mice compared with age-matched treated and untreated PS1-KI mice. (g) Short-term memory and (h) long-term memory performances, as assessed with T opposite of MWM, performed at 1.5 h and 24 h, in treated and untreated PS1-KI and 3xTg-AD mice. Analysis showed statistically significant increase in time spent in the T opposite 1.5 h and 24 h in untreated 6 m.o. 3xTg-AD mice (_P_=0.020) compared with treated and untreated PS1-KI mice at 6 and 12 m.o.a. Data are presented as mean values±the standard error of the mean (S.E.M.). ‘*' indicates P<0.050
Figure 3
Exenatide does not reduce A_β_ and tau pathology in 3xTg-AD mice. Immunohistochemistry was employed to detect deposits of intraneuronal A_β_ (a and b) and h-tau (c and d) in brain slices from treated (_n_=5) and untreated (_n_=5) 3xTg-AD mice. Low magnification (20 × ; scale bar=100 μ_M) images of intraneuronal A_β deposits in untreated (a) or treated (b) 3xTg-AD mice. Insets show a high magnification (40 × ) view of hippocampal CA1 areas (scale bar =20 μ_M). No differences are seen between treated and untreated mice as shown by quantification of intraneuronal A_β loads (e). Low magnification (20 × ) images of h-tau deposits in untreated (c) or treated (d) 3xTg-AD mice. Insets show a high magnification (40 × ) view of hippocampal CA1 areas (scale bar =20 μ_M). No differences are seen between treated and untreated mice as shown by quantification of h-tau levels (f). Quantification of intraneuronal A_β or h-tau levels is expressed with bar graphs of mean pixel counts for mm2± the standard deviation (S.D.)
Figure 4
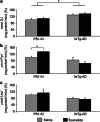
Effects of exenatide on brain COX and LDH in PS1-KI and 3xTg-AD mice. (a) Bar graphs show mitochondrial COX activity in 12-month-old treated and untreated PS1-KI and 3xTg-AD mice. Exenatide had no effects on the mitochondrial respiration of PS1-KI and 3xTg-AD mice. Of note, treated and untreated 3xTg-AD mice showed significantly increased COX activity when compared with PS1-KI mice (untreated PS1-KI versus untreated 3xTg-AD mice, _P_=0.014; untreated PS1-KI versus treated 3xTg-AD mice, _P_=0.003; treated PS1-KI versus untreated 3xTg-AD mice, _P_=0.062; treated PS1-KI versus treated 3xTg-AD mice, _P_=0.017). COX activity is expressed as nmolO2/mgprot/min normalized for brain protein concentration. Data are shown as percentage of mitochondrial COX activity found in untreated PS1-KI mice and presented as mean values±the standard error of the mean (S.E.M.). (b) Forward and (c) reverse brain LDH activities in 12-month-old treated and untreated PS1-KI and 3xTg-AD mice. Exenatide treatment induced significant increase of forward LDH activity in PS1-KI mice (_P_=0.048). Of note, treated PS1-KI mice showed higher forward LDH activity compared to untreated (_P_=0.014) and treated (_P_=0.001) 3xTg-AD mice. LDH activity is expressed as _μ_molSubstrate/mgProtein/min normalized for brain protein concentration. Data are shown as percentage of brain LDH activities found in untreated PS1-KI mice and presented as mean values±(S.E.M.). ‘*' indicates P<0.050
Figure 5
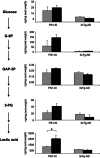
Effects of exenatide on brain concentrations of glucose, glycolytic intermediates, and lactic acid in PS1-KI and 3xTg-AD mice. Bar graphs on the right show brain concentrations of glycolytic intermediates as listed in the left metabolic flow chart (glucose; glucose 6-phosphate (G-6P); glyceraldheyde 3-phosphate (GA3P); 3-phosphoglyceric acid (3-PG), and lactic acid). Exenatide significantly increased lactic acid concentrations in brains of PS1-KI mice (_P_=0.033). Of note, increased brain levels of lactic acid are also found in untreated PS1-KI mice compared with untreated (_P_=0.002) and treated (_P_=0.010) 3xTg-AD mice as well as treated PS1-KI mice compared with the same study groups (_P_=0.010 and 0.008, respectively). Furthermore, exenatide significantly increased brain concentration glucose (_P_=0.018 and 0.009), G-6P (_P_=0.010 and 0.008), and GA3P (_P_=0.062 and 0.007) in treated PS1-KI mice compared with untreated and treated 3xTg-AD mice, respectively. Concentrations are expressed as ng/mg (wet weight). Bars show mean values±the standard error of the mean (S.E.M.). ‘*' indicates P<0.050
Similar articles
- Exenatide exerts cognitive effects by modulating the BDNF-TrkB neurotrophic axis in adult mice.
Bomba M, Granzotto A, Castelli V, Massetti N, Silvestri E, Canzoniero LMT, Cimini A, Sensi SL. Bomba M, et al. Neurobiol Aging. 2018 Apr;64:33-43. doi: 10.1016/j.neurobiolaging.2017.12.009. Epub 2017 Dec 19. Neurobiol Aging. 2018. PMID: 29331730 - Exenatide Reverts the High-Fat-Diet-Induced Impairment of BDNF Signaling and Inflammatory Response in an Animal Model of Alzheimer's Disease.
Bomba M, Granzotto A, Castelli V, Onofrj M, Lattanzio R, Cimini A, Sensi SL. Bomba M, et al. J Alzheimers Dis. 2019;70(3):793-810. doi: 10.3233/JAD-190237. J Alzheimers Dis. 2019. PMID: 31256135 - DA5-CH, a novel GLP-1/GIP dual agonist, effectively ameliorates the cognitive impairments and pathology in the APP/PS1 mouse model of Alzheimer's disease.
Cao Y, Hölscher C, Hu MM, Wang T, Zhao F, Bai Y, Zhang J, Wu MN, Qi JS. Cao Y, et al. Eur J Pharmacol. 2018 May 15;827:215-226. doi: 10.1016/j.ejphar.2018.03.024. Epub 2018 Mar 15. Eur J Pharmacol. 2018. PMID: 29551659 - [Glucagon-like peptide-1 (GLP-1) mimetics: a new treatment for Alzheimer's disease?].
García-Casares N, García-Arnés JA, Gómez-Huelgas R, Valdivielso-Felices P, García-Arias C, González-Santos P. García-Casares N, et al. Rev Neurol. 2014 Dec 1;59(11):517-24. Rev Neurol. 2014. PMID: 25418147 Review. Spanish. - Pharmacology of exenatide (synthetic exendin-4): a potential therapeutic for improved glycemic control of type 2 diabetes.
Nielsen LL, Young AA, Parkes DG. Nielsen LL, et al. Regul Pept. 2004 Feb 15;117(2):77-88. doi: 10.1016/j.regpep.2003.10.028. Regul Pept. 2004. PMID: 14700743 Review.
Cited by
- A multitude of signaling pathways associated with Alzheimer's disease and their roles in AD pathogenesis and therapy.
Gadhave K, Kumar D, Uversky VN, Giri R. Gadhave K, et al. Med Res Rev. 2021 Sep;41(5):2689-2745. doi: 10.1002/med.21719. Epub 2020 Aug 11. Med Res Rev. 2021. PMID: 32783388 Free PMC article. Review. - Role of insulin receptor substance-1 modulating PI3K/Akt insulin signaling pathway in Alzheimer's disease.
Zheng M, Wang P. Zheng M, et al. 3 Biotech. 2021 Apr;11(4):179. doi: 10.1007/s13205-021-02738-3. Epub 2021 Mar 20. 3 Biotech. 2021. PMID: 33927970 Free PMC article. Review. - Inflammation and Insulin Resistance as Risk Factors and Potential Therapeutic Targets for Alzheimer's Disease.
Vinuesa A, Pomilio C, Gregosa A, Bentivegna M, Presa J, Bellotto M, Saravia F, Beauquis J. Vinuesa A, et al. Front Neurosci. 2021 Apr 23;15:653651. doi: 10.3389/fnins.2021.653651. eCollection 2021. Front Neurosci. 2021. PMID: 33967682 Free PMC article. Review. - Potentials of incretin-based therapies in dementia and stroke in type 2 diabetes mellitus.
Groeneveld ON, Kappelle LJ, Biessels GJ. Groeneveld ON, et al. J Diabetes Investig. 2016 Jan;7(1):5-16. doi: 10.1111/jdi.12420. Epub 2015 Oct 3. J Diabetes Investig. 2016. PMID: 26816596 Free PMC article. Review. - Brain energy failure in dementia syndromes: Opportunities and challenges for glucagon-like peptide-1 receptor agonists.
Yassine HN, Solomon V, Thakral A, Sheikh-Bahaei N, Chui HC, Braskie MN, Schneider LS, Talbot K. Yassine HN, et al. Alzheimers Dement. 2022 Mar;18(3):478-497. doi: 10.1002/alz.12474. Epub 2021 Oct 14. Alzheimers Dement. 2022. PMID: 34647685 Free PMC article. Review.
References
- Messier C, Gagnon M. Glucose regulation and cognitive functions: relation to Alzheimer's disease and diabetes. Behav Brain Res. 1996;75:1–11. - PubMed
- Grillo CA, Piroli GG, Rosell DR, Hoskin EK, McEwen BS, Reagan LP. Region specific increases in oxidative stress and superoxide dismutase in the hippocampus of diabetic rats subjected to stress. Neuroscience. 2003;121:133–140. - PubMed
- Reagan LP. Glucose, stress, and hippocampal neuronal vulnerability. Int Rev Neurobiol. 2002;51:289–324. - PubMed
Publication types
MeSH terms
Substances
LinkOut - more resources
Full Text Sources
Other Literature Sources
Medical
Miscellaneous


