Coalescent tree imbalance and a simple test for selective sweeps based on microsatellite variation - PubMed (original) (raw)
Coalescent tree imbalance and a simple test for selective sweeps based on microsatellite variation
Haipeng Li et al. PLoS Comput Biol. 2013.
Abstract
Selective sweeps are at the core of adaptive evolution. We study how the shape of coalescent trees is affected by recent selective sweeps. To do so we define a coarse-grained measure of tree topology. This measure has appealing analytical properties, its distribution is derived from a uniform, and it is easy to estimate from experimental data. We show how it can be cast into a test for recent selective sweeps using microsatellite markers and present an application to an experimental data set from Plasmodium falciparum.
Conflict of interest statement
The authors have declared that no competing interests exist.
Figures
Figure 1. Coalescent trees under recombination and selection.
A: Sketch of a neutral coalescent tree with tree size  . B and C: A selective sweep in locus C leads to a tree of low height (
 small). The selective sweep was initiated by a beneficial mutation at time
  . At some distance from C, a single lineage (circled branch in C) has “recombined away” leading to the unbalanced tree shown at locus B. Note that tree height between trees B and C changes drastically and that
  at locus C and
  at locus B. Multiple recombination events (indicated by the crosses at the bottom line) between loci A and B lead to essentially uncorrelated trees at A and B.
Figure 2. Mean and standard deviation of and for coalescent trees of size .
Shown are the values for  independent realizations.
  -axis: values of
  (black circles) and
  (red squares) are determined for the subtrees originating at node
  ,
,  . The solid gray line shows the theoretical expectation according to eq (3).
Figure 3. Correlation across distance.
Correlation based on simulations ( replicates) of the statistic
  of the true tree. Pearson's correlation coefficient is measured between
  and
and  for pairs of trees at position
  and position
  . Three scenarios are compared: standard neutral model with constant population size (green), population bottleneck (blue) and selective sweep (red). Sample size
  ,
,  ,
,  and a recombinaton rate of
  is assumed. The bottleneck parameters are:
  ,
,  . The selective sweep has a strength of
  . The selected site is at position
  . Under standard neutrality,
  correlation is reached at position
  cM, corresponding to about
  bp.
bp.
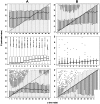
Figure 4. Estimation of .
A: estimation of  by
by  . B: estimation of
  by
by  . First row: standard neutral model. Second row: Selective sweep; estimation of
  at distance
  from selected site. Third row: Selective sweep; distance
  from selected site. Parameters:
  ;
;  (top and bottom row);
  (middle row);
  ;
;  ;
;  .
.
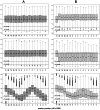
Figure 5. Profile of and along a recombining chromosome.
Plots in column A show the distribution of  , i.e. when the tree topology is known. Plots in column B show the distribution of the estimate
  when the tree topology is unknown, but estimated from microsatellite polymorphism data. Each boxplot corresponds to one of
  marker loci located at the positions indicated on the
  axis. The regions spans
  kb in total. Symmetric step-wise mutation model with
  . Other parameters:
  ,
,  and recombination rate per bp
  (corresponding to 1 cM/Mb). First row: standard neutral model with constant
  . Second row: bottleneck model with severity
  and onset
  . Third row: Selective sweep at locus
  with
with  which was completed
  time units ago. For comparison with the theoretical expectation, the leftmost boxplot in each panel shows the standard normal distribution (labeled ‘N’).
Figure 6. Power to detect loci under recent selection by the three tests defined in eqs (14) to (16)
Parameters: level  (solid) and
  (dotted); selection coefficient
  ; time since fixation
  ; sample size
  ; mutation rate
  ; recombination rate
  . The
. The  axis shows positions to the left (negative values) and right (positive values) of the locus under selection at position
  . Scale is in cM x
 , corresponding here to kb.
Figure 7. Traces of selection around a drug resistance locus in Plasmodium.
Results of tests  (stars),
  (circles) and
  (triangles) applied to a
  kb region sorrounding the pfmdr1 locus in P.falciparum. Shown are significant results on the 5% (open symbols) and 1% (filled symbols) levels. Positions of the examined microsatellite markers are indicated by arrows. Data from .
Similar articles
- Microsatellite markers and genetic mapping in Plasmodium falciparum.
Ferdig MT, Su XZ. Ferdig MT, et al. Parasitol Today. 2000 Jul;16(7):307-12. doi: 10.1016/s0169-4758(00)01676-8. Parasitol Today. 2000. PMID: 10858651 - Genetic diversity and chloroquine selective sweeps in Plasmodium falciparum.
Wootton JC, Feng X, Ferdig MT, Cooper RA, Mu J, Baruch DI, Magill AJ, Su XZ. Wootton JC, et al. Nature. 2002 Jul 18;418(6895):320-3. doi: 10.1038/nature00813. Nature. 2002. PMID: 12124623 - A Bayesian heterogeneous analysis of variance approach to inferring recent selective sweeps.
Marshall JM, Weiss RE. Marshall JM, et al. Genetics. 2006 Aug;173(4):2357-70. doi: 10.1534/genetics.105.053314. Epub 2006 Jun 4. Genetics. 2006. PMID: 16751672 Free PMC article. - The Effects on Neutral Variability of Recurrent Selective Sweeps and Background Selection.
Campos JL, Charlesworth B. Campos JL, et al. Genetics. 2019 May;212(1):287-303. doi: 10.1534/genetics.119.301951. Epub 2019 Mar 28. Genetics. 2019. PMID: 30923166 Free PMC article. - Using mitochondrial and nuclear DNA markers to reconstruct human evolution.
Jorde LB, Bamshad M, Rogers AR. Jorde LB, et al. Bioessays. 1998 Feb;20(2):126-36. doi: 10.1002/(SICI)1521-1878(199802)20:2<126::AID-BIES5>3.0.CO;2-R. Bioessays. 1998. PMID: 9631658 Review.
Cited by
- Robust detection of natural selection using a probabilistic model of tree imbalance.
Dilber E, Terhorst J. Dilber E, et al. Genetics. 2022 Mar 3;220(3):iyac009. doi: 10.1093/genetics/iyac009. Genetics. 2022. PMID: 35100408 Free PMC article. - Sweeps in time: leveraging the joint distribution of branch lengths.
Bisschop G, Lohse K, Setter D. Bisschop G, et al. Genetics. 2021 Oct 2;219(2):iyab119. doi: 10.1093/genetics/iyab119. Genetics. 2021. PMID: 34849880 Free PMC article. - Distance metrics for ranked evolutionary trees.
Kim J, Rosenberg NA, Palacios JA. Kim J, et al. Proc Natl Acad Sci U S A. 2020 Nov 17;117(46):28876-28886. doi: 10.1073/pnas.1922851117. Epub 2020 Nov 2. Proc Natl Acad Sci U S A. 2020. PMID: 33139566 Free PMC article. - Efficiently Summarizing Relationships in Large Samples: A General Duality Between Statistics of Genealogies and Genomes.
Ralph P, Thornton K, Kelleher J. Ralph P, et al. Genetics. 2020 Jul;215(3):779-797. doi: 10.1534/genetics.120.303253. Epub 2020 May 1. Genetics. 2020. PMID: 32357960 Free PMC article. - Adaptation in structured populations and fuzzy boundaries between hard and soft sweeps.
Zheng Y, Wiehe T. Zheng Y, et al. PLoS Comput Biol. 2019 Nov 11;15(11):e1007426. doi: 10.1371/journal.pcbi.1007426. eCollection 2019 Nov. PLoS Comput Biol. 2019. PMID: 31710623 Free PMC article.
References
- Kingman JFC (1982) The coalescent. Stochastic Processes and their Applications 13: 235–248.
- Hudson RR (1990) Gene genealogies and the coalescent process. In: Oxford Surveys in Evolutionary Biology, volume 7. Oxford University Press. pp. 1–44.
- Wakeley J (2009) Coalescent theory – an introduction. Greenwood Village, Colorado: Roberts&Company.
- Ewens W (1972) The sampling theory of selectively neutral alleles. Theor Popul Biol 3: 87–112. - PubMed
Publication types
MeSH terms
Grants and funding
HL was supported by the National Key Basic Research Program of China (2012CB316505), the NSFC grants (31172073 and 91131010) and the Bairen Program, and through a grant to TW by the German Research Foundation (DFG-SFB680, www.dfg.de). The funders had no role in study design, data collection and analysis, decision to publish, or preparation of the manuscript.
LinkOut - more resources
Full Text Sources
Other Literature Sources
Miscellaneous


