A variable CD3⁺ T-cell frequency in peripheral blood lymphocytes associated with type 1 diabetes mellitus development in the LEW.1AR1-iddm rat - PubMed (original) (raw)
A variable CD3⁺ T-cell frequency in peripheral blood lymphocytes associated with type 1 diabetes mellitus development in the LEW.1AR1-iddm rat
Tanja Arndt et al. PLoS One. 2013.
Abstract
Purpose: The LEW.1AR1-iddm rat is an animal model of human type 1 diabetes mellitus (T1DM), which arose through a spontaneous mutation within the MHC-congenic inbred strain LEW.1AR1 (RT1(r²)). In contrast to the diabetes-resistant LEW.1AR1 background strain in LEW.1AR1-iddm rats a highly variable T-cell frequency could be observed in peripheral blood lymphocytes (PBLs).
Methods: In this study we therefore characterised the T-cell repertoire within the PBLs of the two strains by flow cytometry analysis and identified the CD3⁺ T-cell phenotype and its possible linkage to diabetes susceptibility. To map loci conferring susceptibility to variable CD3⁺ T-cell frequency, backcross strains (N2) were generated with the genetically divergent BN and PAR rats for microsatellite analysis.
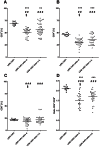
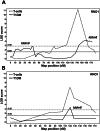
Results: The LEW.1AR1-iddm rat strain was characterised by a higher variability of CD3⁺ T-cells in PBLs along with a slightly decreased mean value compared to the LEW.1AR1 background strain. The reason for this reduction was a decrease in the CD4⁺ T-cell count while the CD8⁺ T-cell proportion remained unchanged. However, both T-cell subpopulations showed a high variability. This resulted in a lower CD4⁺/CD8⁺ T-cell ratio than in LEW.1AR1 rats. Like LEW.1AR1-iddm rats all animals of the backcross populations, N2 BN and N2 PAR rats, also showed large variations of the CD3⁺ T-cell frequency. The phenotype of variable CD3⁺ T-cell frequency mapped to the telomeric region of chromosome 1 (RNO1), which is identical with the already known Iddm8 diabetes susceptibility region. The data indicate that a variable CD3⁺ T-cell frequency in PBLs is genetically linked to diabetes susceptibility in the LEW.1AR1-iddm rat.
Conclusion: The T-cell variability in PBLs could be related to the previously reported imbalance between regulatory and effector T-cell populations which results in beta-cell autoimmunity. Since similar T-cell phenotypes have also been described in human T1DM the identification of the functional role of the observed variable CD3⁺ T-cell frequency may help to understand the mechanisms of autoimmunity in T1DM.
Conflict of interest statement
Competing Interests: The authors have declared that no competing interests exist.
Figures
Figure 1. The percentages of T-cell subpopulations within PBLs of LEW.1AR1 and LEW.1AR1-iddm rats (d. = diabetic animals; n.d. = non-diabetic animals).
The percentages of (A) CD3+, (B) CD4+, (C) CD8+ T-cells, and (D) CD4+/CD8+ T-cell ratio were determined in PBLs by flow cytometric analysis from rats at an age between 35 and 110 days. Each symbol represents the T-cell value for a single animal. The number of animals was for LEW.1AR1 (n = 12), LEW.1AR1-iddm diabetic (n = 34) and LEW.1AR1-iddm non-diabetic (n = 32). The mean values for the different groups are represented by the horizontal bar in the graphs and were compared statistically. **p<0.01/***p<0.0001 LEW.1AR1 compared to LEW.1AR1-iddm, §p<0.05 diabetic compared to non-diabetic LEW.1AR1-iddm rats, and ##p<0.01/###p<0.0001 for range of percentage LEW.1AR1 group compared to LEW.1AR1-iddm group, (ANOVA plus Tukey’s post test).
Figure 2. The percentages of CD3+ T-cells within PBLs of different rat strains and crosses.
CD3+ T-cells were measured in PBLs from (A) LEW.1AR1 and LEW.1AR1-iddm and the F1 populations as well as the backcross population (N2) with the (B) BN and (C) PAR strain by flow cytometric analysis at the age between 35–110 days. Each symbol represents the T-cell value for a single animal. The number of animals was for LEW.1AR1 (n = 12), LEW.1AR1-iddm (n = 66), F1 (LEW.1AR1×LEW.1AR1-iddm) (n = 10), BN (n = 10), F1 (BN×LEW.1AR1-iddm) (n = 6), N2 BN (n = 155), PAR (n = 8), F1 (PAR×LEW.1AR1-iddm) (n = 12), and N2 PAR (n = 151). The mean values for the different groups are represented by the horizontal bar in the graphs. **###**p<0.0001 range of percentage (LEW.1AR1 group compared to LEW.1AR1-iddm group, BN group compared to N2 BN group and PAR group compared to N2 PAR group; ANOVA plus Tukey’s post test).
Figure 3. Association of microsatellite markers on RNO1 with the diabetes syndrome and T-cell frequency within PBLs.
The LOD scores were estimated using E/M algorithms. (A) Analyses of the [(BN×LEW.1AR1-iddm) ×LEW.1AR1-_iddm_] N2 showed a peak marker D1Ztm1 with a LOD score of 4.13 for diabetes (solid line), which was located at 162.1 cM/247.3 Mb. The variability of the T-cell frequency (dotted line) was mapped to the telomeric end of RNO1 (135 to 145 cM). The mapped locus is closely linked to Iddm8. (B) Analyses of the [(PAR×LEW.1AR1-iddm) ×LEW.1AR1-_iddm_] N2 showed a peak marker D1Ztm17 with a LOD score of 3.9 for diabetes and is located at 120.9 cM/213.13 Mb (solid line). The variability of the T-cells frequency (dotted line) was mapped to the telomeric end of chromosome 1 (125 to 135 cM). The mapped locus was closely linked to Iddm8. A permutation test considered a LOD score of >1.5 as significant for association with diabetes (solid line) and a LOD score of >2.8 as significant for association with T-cell frequency (dotted line).
Similar articles
- Variable immune cell frequencies in peripheral blood of LEW.1AR1-iddm rats over time compared to other congenic LEW strains.
Arndt T, Jörns A, Hedrich HJ, Lenzen S, Wedekind D. Arndt T, et al. Clin Exp Immunol. 2014 Jul;177(1):168-78. doi: 10.1111/cei.12323. Clin Exp Immunol. 2014. PMID: 24628466 Free PMC article. - The mutation of the LEW.1AR1-iddm rat maps to the telomeric end of rat chromosome 1.
Weiss H, Arndt T, Jörns A, Lenzen S, Cuppen E, Hedrich HJ, Tiedge M, Wedekind D. Weiss H, et al. Mamm Genome. 2008 Apr;19(4):292-7. doi: 10.1007/s00335-008-9102-4. Epub 2008 Mar 21. Mamm Genome. 2008. PMID: 18357488 - Autoimmune disorders in diabetes.
Boitard C, Debray-Sachs M, Bach JF. Boitard C, et al. Adv Nephrol Necker Hosp. 1986;15:281-305. Adv Nephrol Necker Hosp. 1986. PMID: 3082114 Review.
Cited by
- Experimental Diabetes Mellitus in Different Animal Models.
Al-Awar A, Kupai K, Veszelka M, Szűcs G, Attieh Z, Murlasits Z, Török S, Pósa A, Varga C. Al-Awar A, et al. J Diabetes Res. 2016;2016:9051426. doi: 10.1155/2016/9051426. Epub 2016 Aug 9. J Diabetes Res. 2016. PMID: 27595114 Free PMC article. Review. - Gut immune deficits in LEW.1AR1-iddm rats partially overcome by feeding a diabetes-protective diet.
Crookshank JA, Patrick C, Wang GS, Noel JA, Scott FW. Crookshank JA, et al. Immunology. 2015 Jul;145(3):417-28. doi: 10.1111/imm.12457. Epub 2015 Mar 29. Immunology. 2015. PMID: 25711680 Free PMC article. - An orthologous non-MHC locus in rats and mice is linked to CD4+ and CD8+ T-cell proportion.
Franckaert D, Collin R, Dooley J, Wallis RH, Poussier P, Liston A, Hillhouse EE, Lesage S. Franckaert D, et al. Genes Immun. 2017 Sep;18(3):118-126. doi: 10.1038/gene.2017.9. Epub 2017 May 25. Genes Immun. 2017. PMID: 28539651 - Variable immune cell frequencies in peripheral blood of LEW.1AR1-iddm rats over time compared to other congenic LEW strains.
Arndt T, Jörns A, Hedrich HJ, Lenzen S, Wedekind D. Arndt T, et al. Clin Exp Immunol. 2014 Jul;177(1):168-78. doi: 10.1111/cei.12323. Clin Exp Immunol. 2014. PMID: 24628466 Free PMC article.
References
- Bach JF (1994) Insulin-dependent diabetes mellitus as an autoimmune disease. Endocr Rev 15: 516–542. - PubMed
- Lally FJ, Bach AJ (2003) Animal models of type 1 diabetes. In: Pickup JC, Williams G, editors. Textbook of Diabetes. Oxford: Blackwell Scientific Publications.
- Lenzen S, Tiedge M, Elsner M, Lortz S, Weiss H, et al. (2001) The LEW.1AR1/Ztm-iddm rat: a new model of spontaneous insulin-dependent diabetes mellitus. Diabetologia 44: 1189–1196. - PubMed
- Jörns A, Günther A, Hedrich HJ, Wedekind D, Tiedge M, et al. (2005) Immune cell infiltration, cytokine expression, and beta-cell apoptosis during the development of type 1 diabetes in the spontaneously diabetic LEW.1AR1/Ztm-iddm rat. Diabetes 54: 2041–2052. - PubMed
- Arndt T, Wedekind D, Weiss H, Tiedge M, Lenzen S, et al. (2009) Prevention of spontaneous immune-mediated diabetes development in the LEW.1AR1-iddm rat by selective CD8+ T cell transfer is associated with a cytokine shift in the pancreas-draining lymph nodes. Diabetologia 52: 1381–1390. - PubMed
Publication types
MeSH terms
Substances
Grants and funding
This work has been supported by grants from the Deutsche Forschungsgemeinschaft to AJ and the European Union (Collaborative Project NAIMIT in the 7th Framework Programme, Contract No. 241447) to SL. The funders had no role in study design, data collection and analysis, decision to publish, or preparation of the manuscript.
LinkOut - more resources
Full Text Sources
Other Literature Sources
Medical
Research Materials


