AP4 is a mediator of epithelial-mesenchymal transition and metastasis in colorectal cancer - PubMed (original) (raw)
AP4 is a mediator of epithelial-mesenchymal transition and metastasis in colorectal cancer
Rene Jackstadt et al. J Exp Med. 2013.
Abstract
The basic helix-loop-helix transcription factor AP4/TFAP4/AP-4 is encoded by a c-MYC target gene and displays up-regulation concomitantly with c-MYC in colorectal cancer (CRC) and numerous other tumor types. Here a genome-wide characterization of AP4 DNA binding and mRNA expression was performed using a combination of microarray, genome-wide chromatin immunoprecipitation, next-generation sequencing, and bioinformatic analyses. Thereby, hundreds of induced and repressed AP4 target genes were identified. Besides many genes involved in the control of proliferation, the AP4 target genes included markers of stemness (LGR5 and CD44) and epithelial-mesenchymal transition (EMT) such as SNAIL, E-cadherin/CDH1, OCLN, VIM, FN1, and the Claudins 1, 4, and 7. Accordingly, activation of AP4 induced EMT and enhanced migration and invasion of CRC cells. Conversely, down-regulation of AP4 resulted in mesenchymal-epithelial transition and inhibited migration and invasion. In addition, AP4 induction was required for EMT, migration, and invasion caused by ectopic expression of c-MYC. Inhibition of AP4 in CRC cells resulted in decreased lung metastasis in mice. Elevated AP4 expression in primary CRC significantly correlated with liver metastasis and poor patient survival. These findings imply AP4 as a new regulator of EMT that contributes to metastatic processes in CRC and presumably other carcinomas.
Figures
Figure 1.
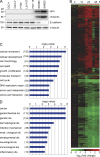
Genome-wide analysis of transcriptional regulation by AP4. (A) The indicated human CRC cell lines were subjected to immunoblot analysis to detect expression of the indicated proteins. Detection of α-tubulin served as a loading control. (B) A heat map showing 1,458 differentially regulated mRNAs that displayed a change in expression ≥1.5-fold 0, 12, 24, and 48 h after Ad-AP4 versus Ad-GFP infection of DLD-1 cells is provided (see
Table S10
for gene identities). A color scale is shown below. (C and D) Genes displaying >1.5-fold differential regulation after AP4 activation were subjected to Gene Ontology analyses. The results for the functional classes “molecular and cellular processes” (C) or “disease” (D) are shown. Numbers in parentheses indicate the number of genes assigned to the respective category.
Figure 2.
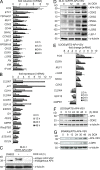
Validation of AP4-mediated differential gene expression. (A and B) The induction (A) or repression (B) of selected genes was confirmed by qPCR analysis with mRNA isolated at the indicated time points from DLD-1 cells infected with an adenovirus expressing AP4. Detection of β-actin was used for normalization. Results represent the mean ± SD (n = 3), and in the case of FOS mean ± SE (n = 2). (C) Expression of ectopic and endogenous AP4 was determined by immunoblot analysis using an AP4-specific antibody. Lysates were obtained from SW620 or DLD-1/pRTR-AP4-VSV cells treated with DOX for 24 h. (D) Lysates from DLD-1/pRTR-AP4-VSV cells treated with DOX for the indicated periods were subjected to immunoblot analysis for the indicated proteins. (E) Quantification of mRNA expression of several putative AP4 target genes after activation of a conditional AP4 allele in U2OS cells by addition of DOX for the indicated periods. Expression was normalized to β-actin expression. Experiments were performed in triplicates. Results represent the mean ± SD (n = 3). (F) Detection of the indicated protein expression levels by immunoblot analysis after activation of a conditional AP4 allele in U2OS cells by addition of DOX for the indicated periods. (G) Detection of the indicated protein expression levels by immunoblot analysis after activation of a conditional AP4 allele in SW480 cells by addition of DOX for the indicated periods. In C, D, F and G, the detection of α-tubulin served as a loading control.
Figure 3.
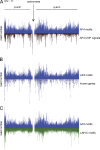
Comparison of the distribution of AP4-binding motifs with ChIP signals, transcription units, and c-MYC motifs on chromosome 11. Gene distributions are shown according to UCSC annotation. Raw ChIP-seq reads are shown before peak calling. The transcription factor–binding motifs CAGCTG (AP4) and CACGTG (c-MYC) were mapped to the human genome (hg19). (A) AP4 motif distribution compared with AP4-derived ChIP signals. (B) Comparison of AP4-binding motif distribution with the location of known genes. (C) Comparison of the distribution of AP4- with c-MYC–binding motifs.
Figure 4.
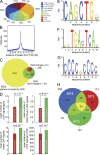
Genome-wide analyses of AP4 occupancy. DLD-1/pRTR-AP4-VSV cells were treated with DOX for 24 h. After ChIP with an AP4-specific antibody, the coprecipitated DNA was subjected to next generation sequencing. For details of the ChIP-seq analysis, see Materials and methods. (A) Localization of called ChIP signals. ChIP signals were assigned using the closest TSS and mapped to specific genomic regions using UCSC annotations. (B) AP4-binding pattern in the vicinity of the TSS. ChIP signals located within a range of 10 kbp up- or downstream of the TSS of 10,636 genes were analyzed. (C) Proportion of differentially expressed genes with AP4 binding in the promoter region. Results of mRNA expression analysis (green and red) and AP4 occupancy were compared (yellow). (D) Comparison of AP4-derived ChIP signals at the promoters of AP4-induced and -repressed genes. Peaks located within 5 kbp up- and 3 kbp downstream of a TSS were considered. The p-values were calculated using a two-sample Kolmogorov-Smirnov test. (E) Refinement of the AP4-binding motif by MEME analysis of AP4 ChIP-seq results. 485 ChIP signals in close proximity to a TSS with at least 25 overlapping reads were included. (F and G) Specific enrichment of AP1 and SP1 sites in the vicinity of AP4 sites was determined by the MEME and Gibbs motif samplers. (H) Distribution of co-occurring motifs in proximity of 485 ChIP-seq peaks with at least 25 overlapping, AP4-derived reads. 62 ChIP signals did not contain any of the three motifs.
Figure 5.
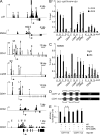
Analysis of AP4 occupancy at selected promoters. (A) Representative ChIP-seq results for seven selected promoters. All results besides those for CDK2 are shown after peak calling. Asterisks represent bioinformatically predicted CAGCTG motifs. Closed circles represent CAGCTG motifs (CACCTG in the CDH1 promoter) analyzed by qChIP. Letters and horizontal bars represent the qPCR amplicons used for qChIP analysis in B. (B) DLD-1/pRTR-AP4-VSV cells were treated with DOX for 24 h and subjected to qChIP analysis with an AP4-specific or, as a reference, IgG antibody. (C) SW620 cells were subjected to qChIP analysis with an AP4-specific or, as a reference, IgG antibody. In B and C, the acetylcholine receptor (AchR) promoter, which lacks AP4-binding motifs, served as a negative control, and results are depicted as mean ± SD (n = 3). (D and E) Scheme of CDH1/E-cadherin reporters (wt = wild-type; mut = three CACCTG motifs mutated) that were used for the dual-luciferase assay (E) 48 h after transfection of the indicated reporters and the indicated AP4 constructs (ΔBR = deleted DNA binding region) into DLD-1 cells. Experiments in E were performed in triplicates (n = 3); error bars indicate SD; significance level as indicated: **, P < 0.01.
Figure 6.
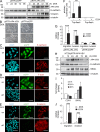
Ectopic AP4 induces EMT in CRC cells. (A) A conditional AP4 allele was induced in DLD-1 cells by addition of DOX for the indicated periods. As a control, DLD-1 cells harboring a pRTR vector were treated with DOX. Protein lysates were subjected to immunoblot analysis for detection of the indicated proteins. (B) Representative phase-contrast pictures of DLD-1 cells 96 h after activation of a conditional AP4 allele or, as a control, of eGFP by addition of DOX. (C–E) Confocal microscopy of DLD-1 cells ectopically expressing AP4 after induction by DOX or the respective untreated control: E-cadherin and β-catenin were detected by indirect immunofluorescence. F-actin was visualized with Alexa Fluor 647–labeled Phalloidin. Cellular DNA was stained with DAPI. (B–E) Bars, 50 µm. (F) Dual-luciferase assay 24 h after transfection of the indicated TCF4 reporter constructs and simultaneous induction of conditional AP4 expression by addition of DOX. (G) Boyden chamber transwell assay of cellular migration or invasion in DLD-1 cells harboring a conditional AP4 allele or, as a control, the control vector only expressing eGFP. Cells were cultivated in the presence or absence of DOX for 96 h with serum reduction to 0.1% for the last 24 h. To analyze invasion, membranes were coated with Matrigel. After 48 h, cells were fixed and stained with DAPI. The mean number of cells in five fields per membrane was counted in three different inserts. Relative invasion or migration is expressed as the value of test cells to control cells. (H) A conditional AP4 allele was induced in HT29 cells by addition of DOX for the indicated periods. Protein lysates were subjected to immunoblot analysis for detection of the indicated proteins. (A and H) α-Tubulin detection served as a loading control. (I) qPCR analysis of RNA obtained at the indicated time points after AP4 activation. β-Actin was used for normalization. Results represent the mean ± SD (n = 3). (J) Boyden chamber transwell assay of cellular migration or invasion as in G in HT29 cells harboring a conditional AP4 allele. Experiments in F, G, and J were performed in triplicates (n = 3). Error bars indicate SD; significance level as indicated: **, P < 0.01; ***, P < 0.001.
Figure 7.
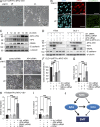
Analyses of the requirement of AP4 and SNAIL for EMT-associated traits. (A and B) Immunoblot (A) and qPCR analysis (B) of SW480 cells harboring episomal plasmids for conditional expression of two different miRNAs directed against AP4 (AP4mi1 or AP4mi2) or a nonsilencing miRNA (NonS). For generation of the miRNAs, see Materials and methods. Cells were treated with DOX for 48 h. (C) Transwell Boyden chamber assay of cellular migration or invasion after conditional down-regulation of AP4 in SW480 cells. (D and E) 96 h after AP4 activation by addition of DOX and concomitant _SNAIL_-specific siRNA transfection of DLD-1 cells, lysates were subjected to immunoblot analysis of the indicated proteins (D) or phase-contrast pictures were obtained (E). (F) Transwell Boyden chamber assay of cellular migration and invasion in DLD-1 cells with and without AP4 activation by addition of DOX and/or transfection of _SNAIL_-specific siRNAs for 96 h. For the last 24 h, the serum concentration was reduced to 0.1%. To analyze invasion, membranes were coated with Matrigel. After 48 h, cells were fixed and stained with DAPI. The mean number of cells in five fields per membrane was counted in three different inserts. Relative invasion or migration is expressed as the cell number in the test versus the control (ctrl. siRNA or without DOX) samples. (G and H) 96 h after SNAIL activation by DOX and concomitant _AP4_-specific siRNA transfection of DLD-1 cells, lysates were subjected to immunoblot analysis of the indicated proteins (G) or phase-contrast pictures were obtained (H). (E and H) Bars, 50 µm. (I) Transwell Boyden chamber assay as in F but after SNAIL activation and AP4 down-regulation as indicated. For siRNA transfections (D–I), identical total siRNA concentrations (20 nM) were achieved by reconstitution with control siRNA. Experiments in B, C, F, and I were performed in triplicates (n = 3); error bars indicate SD; significance level as indicated: *, P < 0.05; ***, P < 0.001.
Figure 8.
A circuitry involving c-MYC, AP4, and SNAIL regulates EMT and invasion. (A) Representative phase-contrast pictures of DLD-1/pRTR–c-MYC–VSV cells after addition of DOX for 96 h. (B) Confocal microscopy analysis 96 h after DOX treatment as in Fig. 5 (C–E). (C) Protein lysates obtained after DOX treatment for the indicated periods were subjected to immunoblot analysis. Detection of α-tubulin served as a loading control. (D and E) Immunoblot analysis of the indicated cell lines 96 h after c-MYC activation by DOX and concomitant siRNA transfection (D) and phase-contrast microscopy of DLD-1/pRTR–c-MYC–VSV cells 96 h after addition of DOX and/or transfection with the indicated siRNAs (E). (A, B, and E) Bars, 50 µm. (F) 72 h after c-MYC activation and/or transfection with the indicated siRNAs, cells were subjected to a wound healing assay. Wound closure was determined 48 h after scratching. (G) Cellular invasion was determined in a transwell Boyden chamber assay 96 h after addition of DOX and/or transfection with the indicated siRNAs. After 48 h, cells were fixed and stained with DAPI. The mean number of cells in five fields per membrane was counted in three different inserts. (H and I) Cellular migration (H) and invasion (I) of HT29 ectopically expressing c-MYC as described in G. Relative invasion or migration is expressed as the value of test cells to control cells. (J) Schematic model of the c-MYC/AP4/SNAIL circuitry. (D–G) For siRNA transfections, identical total siRNA concentrations (20 nM) were achieved by reconstitution with control siRNA. (F–I) Experiments were performed in triplicates (n = 3); error bars indicate SD; significance level as indicated: ***, P < 0.001.
Figure 9.
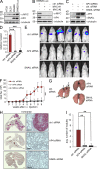
Requirement of AP4 for metastasis in a xenograft mouse model. (A) Detection of c-MYC and AP4 protein in the indicated CRC cell lines by immunoblot analysis. (B and C) SW620 cells stably expressing luciferase were transfected with the indicated siRNAs. 72 h later, protein lysates were subjected to immunoblot analysis of the indicated proteins. (A–C) Detection of α-tubulin served as loading control. (D) Transwell Boyden chamber assay of cellular invasion. SW620-Luc cells were transfected with the indicated siRNAs. After 72 h, cells were seeded into a transwell chamber and analyzed as in Fig. 7 G. (E) SW620-Luc cells were transfected with the indicated siRNAs. After 72 h, cells were injected into the tail veins of NOD/SCID mice (n = 6 for each siRNA). 9 wk later, representative bioluminescence images were obtained. (F) Bioluminescence signals recorded at the indicated time points are represented as total flux. (G) Lungs were resected 9 wk after injection of SW620-Luc cells. Arrows indicate metastatic tumor nodules. (H) Detection of human Vimentin (red) in the lungs of mice injected with SW620-Luc cells transfected with the indicated siRNAs. Bars, 500 µm. (I) Quantification of metastatic nodules in the lung per mouse 9 wk after injection of SW620-Luc cells transfected with the indicated siRNAs. For the analysis in D (n = 3) and F and I (n = 6), error bars represent SD; significance level as indicated: **, P < 0.01; ***, P < 0.001.
Figure 10.
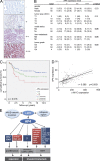
Association of AP4 with metastasis and poor patient survival. (A) The intensity of nuclear AP4 staining was assigned the following scores: none = −, weak = +, moderate = ++, and strong = +++ expression. Examples of representative immunohistochemistry results are shown. Bars, 100 µm. (B) AP4 expression in primary colon cancer samples of 110 patients who underwent surgical tumor resection at the Ludwig-Maximilians University of Munich between 1994 and 2005. Percentage values are given in parentheses. 55 control cases had colon cancers without distant metastases at the time of diagnosis and disease-free survival of at least 5 yr after primary surgical resection. Data were analyzed using the _χ_2 test. (C) Kaplan–Meier plot of CRC specimens (n = 227) with weak (1+), moderate (2+), and strong (3+) AP4 expression. A log-rank test indicated statistical significance (P = 0.016). (D) The expression of AP4 and c-MYC mRNA was analyzed in the TCGA CRC dataset (
). 197 of 276 CRC samples were informative. The linear regression was determined using a Pearson correlation analyses. Dashed lines indicate the confidence interval. (E) Model summarizing the main findings of this study. c-MYC induces expression of AP4, which either induces or represses target genes, of which selected examples are depicted. The biological outcomes of the AP4-mediated regulations with relevance to cancer are indicated in gray boxes. Dotted lines indicate inferred biological functions of AP4 that remain to be proven experimentally. The gene or genes linking AP4 to the regulation of stemness remain to be characterized.
Similar articles
- USP22 drives colorectal cancer invasion and metastasis via epithelial-mesenchymal transition by activating AP4.
Li Y, Yang Y, Li J, Liu H, Chen F, Li B, Cui B, Liu Y. Li Y, et al. Oncotarget. 2017 May 16;8(20):32683-32695. doi: 10.18632/oncotarget.15950. Oncotarget. 2017. PMID: 28427243 Free PMC article. - MicroRNA-302c represses epithelial-mesenchymal transition and metastasis by targeting transcription factor AP-4 in colorectal cancer.
Ma W, Liu B, Li J, Jiang J, Zhou R, Huang L, Li X, He X, Zhou Q. Ma W, et al. Biomed Pharmacother. 2018 Sep;105:670-676. doi: 10.1016/j.biopha.2018.06.025. Epub 2018 Jun 12. Biomed Pharmacother. 2018. PMID: 29906744 - p53-induced miR-15a/16-1 and AP4 form a double-negative feedback loop to regulate epithelial-mesenchymal transition and metastasis in colorectal cancer.
Shi L, Jackstadt R, Siemens H, Li H, Kirchner T, Hermeking H. Shi L, et al. Cancer Res. 2014 Jan 15;74(2):532-42. doi: 10.1158/0008-5472.CAN-13-2203. Epub 2013 Nov 27. Cancer Res. 2014. PMID: 24285725 - SNAIL and miR-34a feed-forward regulation of ZNF281/ZBP99 promotes epithelial-mesenchymal transition.
Hahn S, Jackstadt R, Siemens H, Hünten S, Hermeking H. Hahn S, et al. EMBO J. 2013 Nov 27;32(23):3079-95. doi: 10.1038/emboj.2013.236. Epub 2013 Nov 1. EMBO J. 2013. PMID: 24185900 Free PMC article. - Transcription Factor AP4 Mediates Cell Fate Decisions: To Divide, Age, or Die.
Wong MM, Joyson SM, Hermeking H, Chiu SK. Wong MM, et al. Cancers (Basel). 2021 Feb 8;13(4):676. doi: 10.3390/cancers13040676. Cancers (Basel). 2021. PMID: 33567514 Free PMC article. Review.
Cited by
- Dysregulation of transcripts SMAD4-209 and SMAD4-213 and their respective promoters in colon cancer cell lines.
Babic T, Ugrin M, Jeremic S, Kojic M, Dinic J, Banovic Djeri B, Zoidakis J, Nikolic A. Babic T, et al. J Cancer. 2024 Aug 6;15(15):5118-5131. doi: 10.7150/jca.98911. eCollection 2024. J Cancer. 2024. PMID: 39132157 Free PMC article. - Mechanisms of Metastasis in Colorectal Cancer and Metastatic Organotropism: Hematogenous versus Peritoneal Spread.
Pretzsch E, Bösch F, Neumann J, Ganschow P, Bazhin A, Guba M, Werner J, Angele M. Pretzsch E, et al. J Oncol. 2019 Sep 19;2019:7407190. doi: 10.1155/2019/7407190. eCollection 2019. J Oncol. 2019. PMID: 31641356 Free PMC article. Review. - miR-34a and IRE1A/XBP-1(S) Form a Double-Negative Feedback Loop to Regulate Hypoxia-Induced EMT, Metastasis, Chemo-Resistance and Autophagy.
Bouznad N, Rokavec M, Öner MG, Hermeking H. Bouznad N, et al. Cancers (Basel). 2023 Feb 10;15(4):1143. doi: 10.3390/cancers15041143. Cancers (Basel). 2023. PMID: 36831485 Free PMC article. - Cytokine- and chemokine-induced inflammatory colorectal tumor microenvironment: Emerging avenue for targeted therapy.
Bhat AA, Nisar S, Singh M, Ashraf B, Masoodi T, Prasad CP, Sharma A, Maacha S, Karedath T, Hashem S, Yasin SB, Bagga P, Reddy R, Frennaux MP, Uddin S, Dhawan P, Haris M, Macha MA. Bhat AA, et al. Cancer Commun (Lond). 2022 Aug;42(8):689-715. doi: 10.1002/cac2.12295. Epub 2022 Jul 5. Cancer Commun (Lond). 2022. PMID: 35791509 Free PMC article. Review. - Suppressor of cytokine signaling 1 modulates invasion and metastatic potential of colorectal cancer cells.
David M, Naudin C, Letourneur M, Polrot M, Renoir JM, Lazar V, Dessen P, Roche S, Bertoglio J, Pierre J. David M, et al. Mol Oncol. 2014 Jul;8(5):942-55. doi: 10.1016/j.molonc.2014.03.014. Epub 2014 Mar 25. Mol Oncol. 2014. PMID: 24726456 Free PMC article.
References
- Ansieau S., Bastid J., Doreau A., Morel A.P., Bouchet B.P., Thomas C., Fauvet F., Puisieux I., Doglioni C., Piccinin S., et al. 2008. Induction of EMT by twist proteins as a collateral effect of tumor-promoting inactivation of premature senescence. Cancer Cell. 14:79–89 10.1016/j.ccr.2008.06.005 - DOI - PubMed
- Bornkamm G.W., Berens C., Kuklik-Roos C., Bechet J.M., Laux G., Bachl J., Korndoerfer M., Schlee M., Hölzel M., Malamoussi A., et al. 2005. Stringent doxycycline-dependent control of gene activities using an episomal one-vector system. Nucleic Acids Res. 33:e137 10.1093/nar/gni137 - DOI - PMC - PubMed
Publication types
MeSH terms
Substances
LinkOut - more resources
Full Text Sources
Other Literature Sources
Medical
Molecular Biology Databases
Research Materials
Miscellaneous
