Protein trafficking abnormalities in Drosophila tissues with impaired activity of the ZIP7 zinc transporter Catsup - PubMed (original) (raw)
. 2013 Jul;140(14):3018-27.
doi: 10.1242/dev.088336. Epub 2013 Jun 19.
Affiliations
- PMID: 23785054
- PMCID: PMC3699284
- DOI: 10.1242/dev.088336
Protein trafficking abnormalities in Drosophila tissues with impaired activity of the ZIP7 zinc transporter Catsup
Casper Groth et al. Development. 2013 Jul.
Abstract
Developmental patterning requires the precise interplay of numerous intercellular signaling pathways to ensure that cells are properly specified during tissue formation and organogenesis. The spatiotemporal function of the Notch signaling pathway is strongly influenced by the biosynthesis and intracellular trafficking of signaling components. Receptors and ligands must be trafficked to the cell surface where they interact, and their subsequent endocytic internalization and endosomal trafficking is crucial for both signal propagation and its down-modulation. In a forward genetic screen for mutations that alter intracellular Notch receptor trafficking in Drosophila epithelial tissues, we recovered mutations that disrupt the Catsup gene, which encodes the Drosophila ortholog of the mammalian ZIP7 zinc transporter. Loss of Catsup function causes Notch to accumulate abnormally in the endoplasmic reticulum (ER) and Golgi compartments, resulting in impaired Notch signaling. In addition, Catsup mutant cells exhibit elevated ER stress, suggesting that impaired zinc homeostasis causes increased levels of misfolded proteins within the secretory compartment.
Keywords: Drosophila; Notch; Protein trafficking; Secretory pathway; Zinc transporter.
Figures
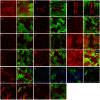
Fig. 1.
Notch accumulates abnormally in pre-endocytic compartments in Catsup mutant tissues. (A-M′) Confocal optical sections through Drosophila wing imaginal discs bearing homozygous mutant clones of Catsup, immunostained for specific proteins (red) together with the corresponding GFP signal (green) to identify clone locations in each image pair (absence of green signal in A′,B′,C′,D′,E′,F′,G′,H′,I′,J′,K′,L′,M′). (A-C′) Notch accumulation in apical membranes (A,A′) and basal cell regions (B,B′) of fixed tissue clones, and in a confocal _z_-series (C,C′) encompassing the apicobasal extent of the disc monolayer epithelium from apical (top) to basal (bottom). (D-E′) Distribution of newly endocytosed Notch in live tissue that was labeled with antibodies directed against the Notch extracellular domain prior to fixation, showing apical membranes (D,D′) and basal cell regions (E,E′). (F-H′) Delta (Dl) protein distribution in basal cell regions of fixed tissue (F,F′), apical membranes of live-stained tissue (G,G′) and basal cell regions (H,H′) of live-stained tissue. (I-J′) DE-Cadherin (DE-Cad; apical region in I,I′; basal region in J,J′). (K,K′) α-Spectrin distribution in fixed tissue clones. (L-M′) EGFR distribution in apical (L,L′) and basal (M,M′) regions of fixed tissue clones. (N) Distribution of epitope-tagged Amyloid Precursor-like Protein (APPL-V5) expressed under control of daughterless gene regulatory elements in wild-type control tissue. (O,O′) Accumulation of APPL-V5 (green) in Catsup mutant clones, shown in an apical view (O) and in an apicobasal confocal _z_-series (O′). Catsup clones were produced in wing discs using the MARCM system (Lee and Luo, 2001) to express APPL-V5 in clone cells only. Nuclei are counterstained with Hoechst 33258 (blue) in panels N-O′. (P-P′) Colocalization of transgenically expressed APPL-V5 (P; green signal) and endogenous Notch (P′; red signal) in fixed Catsup clone tissue; merged overlay of the confocal signals in P and P′ is shown in P′; yellow arrowheads indicate colocalized Notch and APPL-V5 overaccumulation. (Q,Q′) Notch accumulation in a basal cell region of a Catsup mutant clone in a N54l9/+ genetic background (Notch signal in red; GFP signal in green as in A-M′); heterozygous Notch larvae were identified by their reduced Cut expression at the DV boundary (see Materials and methods).
Fig. 2.
Structure of Drosophila Catsup protein and locations of the Catsup47 and Catsup48 mutations. Catsup protein showing the predicted signal peptide (SP), histidine-rich regions (His), conserved HELP domain (Suzuki and Endo, 2002) and six transmembrane domains (TM1-6). Locations of amino acid alterations in the newly isolated mutants Catsup47 and Catsup48 are indicated.
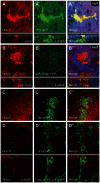
Fig. 3.
Accumulation of Notch in the biosynthetic and secretory compartments in Catsup mutant clones. (A-B′) Catsup mutant clones genetically marked by absence of lacZ expression were generated in wing imaginal discs and examined for Notch accumulation (red; A,B) together with either the ER chaperone marker PDI-GFP (green; A′) or the Golgi marker sqh-Golgi-YFP (green; Golgi-YFP; B′), with corresponding merged images of Notch and the relevant organelle marker (A′,B′). (C-D′) Functional rescue of Notch trafficking defects in Catsup mutant clones expressing transgenic wild-type Catsup-V5. Homozygous Catsup mutant clones were produced in wing discs using the MARCM system (Lee and Luo, 2001) to express wild-type Catsup-V5 in the mutant clone cells, then immunostained for endogenous Notch (red; C,D), the V5 epitope tag, which marks mutant cells only (green; C′,D′), and examined for apical (C,C′) and basal (D,D′) accumulation of Notch and Catsup-V5. C′ and D′ show the corresponding merged Notch and Catsup-V5 signals. For each sample in A-D′, the corresponding confocal _z_-series showing the apicobasal distribution of signal(s) is included beneath the gray bar.
Fig. 4.
Localization of Catsup in the biosynthetic and secretory pathway. (A-J′) Localization of transgenically expressed, epitope-tagged Catsup-V5 (red) expressed under regulatory control of patched-GAL4 (Hinz et al., 1994) together with various organelle markers (green) in wing disc peripodial cells (A-A′,C-D′,G-H′) or in wing imaginal disc proper cells (B-B′,E-F′,I-J′). For each tissue sample, the set of three images shows Catsup-V5 protein (A-J), a specific organelle marker (nuclear envelope Lamin in A′,B′; ER-specific KDEL signal in C′,D′,E′,F′; and Golgi-specific GM130 signal in G′,H′,I′,J′), with merged images of the Catsup and the relevant organelle marker in the corresponding panels A′,B′,C′,D′,E′,F′,G′,H′,I′,J′. For each of the low-magnification wing disc images, boxed regions are shown at higher magnification in corresponding panels D-D′,F-F′,H-H′,J-J′.
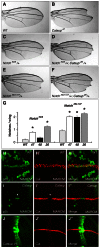
Fig. 5.
_Notch_-related phenotypes in Catsup-deficient tissues and cells. (A) Wild-type adult Drosophila wing blade. (B) Adult wing bearing a Catsup47 mutant clone, showing wing notching and missing wing margin material at tip. (C-F) Representative adult wing notching phenotypes of Notch54l9/+ heterozygotes (C), Notch54l9/+; Catsup26/+ double heterozygotes (D), Notch264-107/+ heterozygotes (E) and Notch264-107/+; Catsup26/+ double heterozygotes (F). (G) Average number of notches per wing blade in Notch54l9/+ and Notch264-107/+ heterozygotes in combination with either a Catsup wild-type genotype (WT), Catsup47/+ (47), Catsup48/+ (48) and Catsup26/+ (26), as denoted at the bottom; asterisks indicate Catsup heterozygous mutant genotypes that exhibit statistically significant (P<0.05) increases in wing notching incidence relative to Catsup+ (_n_=50 flies/100 wings per genotype. Notch54l9 genotypes: wild type=0.20±0.049; _Catsup47_=0.79±0.081, _P_=2.6×10⁻⁹; _Catsup48_=0.34±0.064, _P_=0.084; _Catsup26_=1.23±0.066, _P_=2.1×10⁻²⁰. Notch264-107 genotypes: wild type=0.90±0.075; _Catsup47_=2.01±0.073 _P_=5.9×10⁻²³; _Catsup48_=1.99±0.086, _P_=4.0×10⁻¹⁸; _Catsup26_=2.26±0.090, _P_=2.6×10⁻²⁴). The Catsup wild-type genotype used for these crosses was the parental stock y w; P{ry[+t7.2]=neoFRT}40A P{w[+mW.hs]=FRT(whs)}G13 employed in our initial mutagenesis screen. Data are mean numbers of notches per wing ± s.e.m. (H-I′) Expression of the Notch target Cut (red in H′,I′) in p35-expressing wild-type control clones (H-H′) and Catsup mutant clones (I-I′), in which the clone cells are positively marked by p35 expression (green in H and I). Merged images of the Cut and p35 signals are shown on the right in H′ and I′; white arrowhead in I and I′ indicates Catsup mutant cells at the DV boundary that fail to express Cut. (J-J′) Overexpression of Catsup-V5 (green) under the control of patched-GAL4 (J) does not affect Cut expression (J′; red) where Catsup-V5 overexpression intersects with the DV boundary; merged signals for Catsup-V5 and Cut expression are shown in J′.
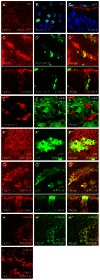
Fig. 6.
Induction of ER stress and apoptosis in Catsup mutant cells. (A) Notch distribution (red) and lack of induction of Xbp1-GFP (green) in wild-type Drosophila wing disc cells; the image represents a compilation of ∼40 separate confocal scans extending from the apical surface to basement membrane. (B) Induction of Xbp1-GFP (green) in wing disc peripodial membrane cells; nuclei counterstained with Hoechst 33258 (blue). (C) Notch accumulation (red), Xbp1-GFP expression (green) and nuclear Hoechst 33258 (blue) in a confocal _z_-series showing an apicolateral region of the wing disc and overlying apical peripodial membrane (top). (D-D′) Notch distribution (red in D), induction of Xbp1-GFP (green), and merged Notch and Xbp1-GFP signals (D′) in Catsup-deficient clones marked by elevated Notch accumulation; images represent compilations of ∼40 separate confocal scans extending from the apical surface to basement membrane. For each xy confocal image in D-D′, a corresponding _z_-series displaying the apicobasal axis of the disc is shown beneath the gray bar. (E-E′) Expression of activated Caspase 3 (red in E) in Catsup mutant wing disc clones, showing clone locations (areas devoid of green GFP signal in E′), and merged image of both signals in E′. (F-G′) MARCM-directed expression of baculovirus survival factor p35 (green in F′,G′; see Materials and methods) permits survival of larger Catsup mutant clones, which exhibit reduced apical Notch accumulation (red in F), elevated basal Notch accumulation (red in G) and pronounced vesicular Notch accumulation (compare mutant clone cells with non-mutant cells within F and G); F-F′ and G-G′ depict apical and basal cell regions, respectively, merged Notch and p35 signals are shown in F′ and G′, and corresponding apicobasal confocal _z_-series are shown beneath the gray bars for G-G′. (H-H′) Elevated Notch accumulation (red) in basal cell regions of a Catsup mutant clone (H) that overexpresses Hsc70 (green) using MARCM (H′); merged Notch and Hsc70 signals are depicted in H′. (I) Abnormal Notch accumulation (red) in multiple unmarked Catsup mutant clones that overexpress O-fut1 using MARCM.
Similar articles
- Disruption of Drosophila melanogaster lipid metabolism genes causes tissue overgrowth associated with altered developmental signaling.
Sasamura T, Matsuno K, Fortini ME. Sasamura T, et al. PLoS Genet. 2013 Nov;9(11):e1003917. doi: 10.1371/journal.pgen.1003917. Epub 2013 Nov 7. PLoS Genet. 2013. PMID: 24244188 Free PMC article. - Notch signaling during development requires the function of awd, the Drosophila homolog of human metastasis suppressor gene Nm23.
Ignesti M, Barraco M, Nallamothu G, Woolworth JA, Duchi S, Gargiulo G, Cavaliere V, Hsu T. Ignesti M, et al. BMC Biol. 2014 Feb 14;12:12. doi: 10.1186/1741-7007-12-12. BMC Biol. 2014. PMID: 24528630 Free PMC article. - Genetic circuitry modulating notch signals through endosomal trafficking.
Hori K, Sen A, Artavanis-Tsakonas S. Hori K, et al. Methods Enzymol. 2014;534:283-99. doi: 10.1016/B978-0-12-397926-1.00016-0. Methods Enzymol. 2014. PMID: 24359960 - Endocytosis and control of Notch signaling.
Kandachar V, Roegiers F. Kandachar V, et al. Curr Opin Cell Biol. 2012 Aug;24(4):534-40. doi: 10.1016/j.ceb.2012.06.006. Epub 2012 Jul 18. Curr Opin Cell Biol. 2012. PMID: 22818956 Free PMC article. Review. - The Role of Intracellular Trafficking of Notch Receptors in Ligand-Independent Notch Activation.
Hounjet J, Vooijs M. Hounjet J, et al. Biomolecules. 2021 Sep 16;11(9):1369. doi: 10.3390/biom11091369. Biomolecules. 2021. PMID: 34572582 Free PMC article. Review.
Cited by
- Targeting Notch Trafficking and Processing in Cancers.
Pagliaro L, Sorrentino C, Roti G. Pagliaro L, et al. Cells. 2020 Sep 29;9(10):2212. doi: 10.3390/cells9102212. Cells. 2020. PMID: 33003595 Free PMC article. Review. - ZnT7 RNAi favors RafGOFscrib-/--induced tumor growth and invasion in Drosophila through JNK signaling pathway.
Wei T, Ji X, Gao Y, Zhu X, Xiao G. Wei T, et al. Oncogene. 2021 Mar;40(12):2217-2229. doi: 10.1038/s41388-021-01703-x. Epub 2021 Mar 1. Oncogene. 2021. PMID: 33649534 - Biogenesis of zinc storage granules in Drosophila melanogaster.
Tejeda-Guzmán C, Rosas-Arellano A, Kroll T, Webb SM, Barajas-Aceves M, Osorio B, Missirlis F. Tejeda-Guzmán C, et al. J Exp Biol. 2018 Mar 19;221(Pt 6):jeb168419. doi: 10.1242/jeb.168419. J Exp Biol. 2018. PMID: 29367274 Free PMC article. - Dopamine drives Drosophila sechellia adaptation to its toxic host.
Lavista-Llanos S, Svatoš A, Kai M, Riemensperger T, Birman S, Stensmyr MC, Hansson BS. Lavista-Llanos S, et al. Elife. 2014 Dec 9;3:e03785. doi: 10.7554/eLife.03785. Elife. 2014. PMID: 25487989 Free PMC article. - Discovery of a ZIP7 inhibitor from a Notch pathway screen.
Nolin E, Gans S, Llamas L, Bandyopadhyay S, Brittain SM, Bernasconi-Elias P, Carter KP, Loureiro JJ, Thomas JR, Schirle M, Yang Y, Guo N, Roma G, Schuierer S, Beibel M, Lindeman A, Sigoillot F, Chen A, Xie KX, Ho S, Reece-Hoyes J, Weihofen WA, Tyskiewicz K, Hoepfner D, McDonald RI, Guthrie N, Dogra A, Guo H, Shao J, Ding J, Canham SM, Boynton G, George EL, Kang ZB, Antczak C, Porter JA, Wallace O, Tallarico JA, Palmer AE, Jenkins JL, Jain RK, Bushell SM, Fryer CJ. Nolin E, et al. Nat Chem Biol. 2019 Feb;15(2):179-188. doi: 10.1038/s41589-018-0200-7. Epub 2019 Jan 14. Nat Chem Biol. 2019. PMID: 30643281 Free PMC article.
References
- Blochlinger K., Bodmer R., Jan L. Y., Jan Y. N. (1990). Patterns of expression of cut, a protein required for external sensory organ development in wild-type and cut mutant Drosophila embryos. Genes Dev. 4, 1322–1331 - PubMed
- Cuajungco M. P., Frederickson C. J., Bush A. I. (2005). Amyloid-β metal interaction and metal chelation. Subcell. Biochem. 38, 235–254 - PubMed
- Diederich R. J., Matsuno K., Hing H., Artavanis-Tsakonas S. (1994). Cytosolic interaction between deltex and Notch ankyrin repeats implicates deltex in the Notch signaling pathway. Development 120, 473–481 - PubMed
Publication types
MeSH terms
Substances
LinkOut - more resources
Full Text Sources
Other Literature Sources
Molecular Biology Databases
Miscellaneous


