Expression of the lysosomal-associated membrane protein-1 (LAMP-1) in astrocytomas - PubMed (original) (raw)
Comparative Study
. 2013 Jun 15;6(7):1294-305.
Print 2013.
Affiliations
- PMID: 23826410
- PMCID: PMC3693194
Comparative Study
Expression of the lysosomal-associated membrane protein-1 (LAMP-1) in astrocytomas
Stine S Jensen et al. Int J Clin Exp Pathol. 2013.
Abstract
Targeting of lysosomes is a novel therapeutic anti-cancer strategy for killing the otherwise apoptosis-resistant cancer cells. Such strategies are urgently needed for treatment of brain tumors, especially the glioblastoma, which is the most frequent and most malignant type. The aim of the present study was to investigate the presence of lysosomes in astrocytic brain tumors focussing also on the therapy resistant tumor stem cells. Expression of the lysosomal marker LAMP-1 (lysosomal-associated membrane protein-1) was investigated by immunohistochemistry in 112 formalin fixed paraffin embedded astrocytomas and compared with tumor grade and overall patient survival. Moreover, double immunofluorescence stainings were performed with LAMP-1 and the astrocytic marker GFAP and the putative stem cell marker CD133 on ten glioblastomas. Most tumors expressed the LAMP-1 protein in the cytoplasm of the tumor cells, while the blood vessels were positive in all tumors. The percentage of LAMP-1 positive tumor cells and staining intensities increased with tumor grade but variations in tumors of the same grade were also found. No association was found between LAMP-1 expression and patient overall survival in the individual tumor grades. LAMP-1/GFAP showed pronounced co-expression and LAMP-1/CD133 was co-expressed as well suggesting that tumor cells including the proposed tumor stem cells contain lysosomes. The results suggest that high amounts of lysosomes are present in glioblastomas and in the proposed tumor stem cells. Targeting of lysosomes may be a promising novel therapeutic strategy against this highly malignant neoplasm.
Keywords: LAMP-1; glioblastomas; immunohistochemistry; lysosomes; tumor stem cells.
Figures
Figure 1
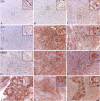
LAMP-1 immunohistochemical expression in astrocytomas. The expression of LAMP-1 was investigated immunohistochemically in diffuse and anaplastic astrocytomas as well as in glioblastomas. The expression in diffuse astrocytomas was primarily found in cells with microglial morphology (A), in blood vessels (B) and in cells with gemistocytic morphology (C). In the anaplastic astrocytomas, cells with a gemistocytic morphology also showed expression of LAMP-1 with both low (D) and high (E) expression levels. Positive cells with other morphologies were also found (F). In glioblastomas the majority of the tumors showed high expression of LAMP-1 in the tumor cells, but also tumors with large negative areas were found. In these areas the highest LAMP-1 expression was found in the blood vessels (G). LAMP-1 expression was found in tumor cells with different morphologies with different degrees of pleomorphism. Both gemistocytic (H) tumor cells as well as multinucleated giant cells (I) were found. Besides being found in tumor cells, LAMP-1 expression was also found in blood vessels (J) and in and around necrotic palisades (K, L). Scalebar A-L 100 μm, inserts 20 μm.
Figure 2
LAMP-1 distribution in astrocytomas. The distribution of LAMP-1 scores was compared for the diffuse and anaplastic astrocytomas and the glioblastomas in four categories. The four categories were percentage LAMP-1 positive tumor cells (A), LAMP-1 tumor cell staining intensity (B), percentage LAMP-1 positive blood vessels (C) and LAMP-1 blood vessel staining intensity (D). A fifth category included was the total sum of LAMP-1 scores (E) divided into three groups with scores from 0-9, 10 and 11-12. In the category percentage positive tumor cells, glioblastomas most often received the highest score of 2 and 3, whereas both the diffuse and anaplastic astrocytomas most often received the score 1 and 2 (A). In the tumor cell staining intensity category, the scores for glioblastomas were evenly distributed between the scores 1-3, whereas the most frequent staining intensity for the diffuse and anaplastic astrocytomas was 1 (B). In the category positive blood vessels, all tumors independently of tumor grade received the score 3 (C). In the category blood vessel staining intensity, there was a small preference for the score 2 (D). For total LAMP-1 score, glioblastomas were almost evenly distributed in the three groups, however, with a small preference for the score 11-12. The diffuse and anaplastic astrocytomas primarily received total scores between 0 and 9 (E).
Figure 3
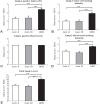
Mean LAMP-1 score in the astrocytomas. The mean LAMP-1 score was compared for diffuse and anaplastic astrocytomas and glioblastomas in the five categories (A-E). The glioblastomas showed the highest mean score in the categories LAMP-1 positive tumor cells (A), LAMP-1 tumor cell staining intensity (B), LAMP-1 blood vessel staining intensity (D) and total LAMP-1 score (E). The same mean score was found for LAMP-1 positive blood vessels (C) in the three tumor grades. Data are analyzed using ANOVA with Bonferroni correction for comparison with control and statistical significance *P<0.05, **P<0.01, ***P<0.001.
Figure 4
Correlation between LAMP-1 scores and overall patient survival. A Kaplan-Meier survival plot for the 72 glioblastoma patients grouped according to the total LAMP-1 immunohistochemical score showed no correlation between LAMP-1 expression and patient overall survival (p=0.820). Group 0-9, n=22, group 10, n=21, group 11-12, n=29.
Figure 5
Double immunofluorescence staining with LAMP-1/GFAP and LAMP-1/CD133. Expression of LAMP-1 in tumor cells and tumor stem cells of 10 glioblastomas were investigated by confocal microscopy and double immunofluorescence using the astrocytic marker GFAP and the tumor stem cell marker CD133, respectively. Co-expression of LAMP-1 and GFAP was identified as a yellow dot-like staining in the cell cytoplasm. It was found in cells with a gemistocytic appearance (A), in tumor cells with other morphologies (B) as well as in multinuclear giant cells (C). Co-expression of LAMP-1 and CD133 was identified as cells with a red cytoplasm representing LAMP-1 and a green membrane staining being CD133. Co-expression was found in CD133 niches consisting of a cluster of several cells expressing CD133 (D) as well as in dispersed CD133 single cells (E and F). The CD133 single cells were surrounded by LAMP-1 positive but CD133 negative cells. The images were recorded by a 60x lens (A, B, D, E) using an additional zoom in some areas (C and F).
Similar articles
- CD133 identifies perivascular niches in grade II-IV astrocytomas.
Christensen K, Schrøder HD, Kristensen BW. Christensen K, et al. J Neurooncol. 2008 Nov;90(2):157-70. doi: 10.1007/s11060-008-9648-8. Epub 2008 Jul 9. J Neurooncol. 2008. PMID: 18612800 - LAMP-1 gene is overexpressed in high grade glioma.
Sarafian VS, Koev I, Mehterov N, Kazakova M, Dangalov K. Sarafian VS, et al. APMIS. 2018 Aug;126(8):657-662. doi: 10.1111/apm.12856. Epub 2018 Jun 19. APMIS. 2018. PMID: 29920782 - Mitosin and pHH3 predict poorer survival in astrocytomas WHO grades II and III.
Varughese RK, Lind-Landström T, Habberstad AH, Salvesen Ø, Haug CS, Sundstrøm S, Torp SH. Varughese RK, et al. J Clin Pathol. 2016 Jan;69(1):26-34. doi: 10.1136/jclinpath-2015-202983. Epub 2015 Jul 17. J Clin Pathol. 2016. PMID: 26188054 - How powerful is CD133 as a cancer stem cell marker in brain tumors?
Cheng JX, Liu BL, Zhang X. Cheng JX, et al. Cancer Treat Rev. 2009 Aug;35(5):403-8. doi: 10.1016/j.ctrv.2009.03.002. Epub 2009 Apr 14. Cancer Treat Rev. 2009. PMID: 19369008 Review. - Pathologic analysis of primary brain tumors.
McComb RD, Burger PC. McComb RD, et al. Neurol Clin. 1985 Nov;3(4):711-28. Neurol Clin. 1985. PMID: 3001488 Review.
Cited by
- Lysosomal Zn2+ release triggers rapid, mitochondria-mediated, non-apoptotic cell death in metastatic melanoma.
Du W, Gu M, Hu M, Pinchi P, Chen W, Ryan M, Nold T, Bannaga A, Xu H. Du W, et al. Cell Rep. 2021 Oct 19;37(3):109848. doi: 10.1016/j.celrep.2021.109848. Cell Rep. 2021. PMID: 34686351 Free PMC article. - Expression and Prognostic Value of Oct-4 in Astrocytic Brain Tumors.
Krogh Petersen J, Jensen P, Dahl Sørensen M, Winther Kristensen B. Krogh Petersen J, et al. PLoS One. 2016 Dec 28;11(12):e0169129. doi: 10.1371/journal.pone.0169129. eCollection 2016. PLoS One. 2016. PMID: 28030635 Free PMC article. - Cellular transformation promotes the incorporation of docosahexaenoic acid into the endolysosome-specific lipid bis(monoacylglycerol)phosphate in breast cancer.
Berg AL, Showalter MR, Kosaisawe N, Hu M, Stephens NC, Sa M, Heil H, Castro N, Chen JJ, VanderVorst K, Wheeler MR, Rabow Z, Cajka T, Albeck J, Fiehn O, Carraway KL 3rd. Berg AL, et al. Cancer Lett. 2023 Mar 31;557:216090. doi: 10.1016/j.canlet.2023.216090. Epub 2023 Feb 10. Cancer Lett. 2023. PMID: 36773796 Free PMC article. - Chaperone-mediated autophagy protects cardiomyocytes against hypoxic-cell death.
Ghosh R, Gillaspie JJ, Campbell KS, Symons JD, Boudina S, Pattison JS. Ghosh R, et al. Am J Physiol Cell Physiol. 2022 Nov 1;323(5):C1555-C1575. doi: 10.1152/ajpcell.00369.2021. Epub 2022 May 18. Am J Physiol Cell Physiol. 2022. PMID: 35584327 Free PMC article. - Methamphetamine induces autophagy as a pro-survival response against apoptotic endothelial cell death through the Kappa opioid receptor.
Ma J, Wan J, Meng J, Banerjee S, Ramakrishnan S, Roy S. Ma J, et al. Cell Death Dis. 2014 Mar 6;5(3):e1099. doi: 10.1038/cddis.2014.64. Cell Death Dis. 2014. PMID: 24603327 Free PMC article.
References
- Stupp R, Mason WP, van den Bent MJ, Weller M, Fisher B, Taphoorn MJ, Belanger K, Brandes AA, Marosi C, Bogdahn U, Curschmann J, Janzer RC, Ludwin SK, Gorlia T, Allgeier A, Lacombe D, Cairncross JG, Eisenhauer E, Mirimanoff RO. Radiotherapy plus concomitant and adjuvant temozolomide for glioblastoma. N Engl J Med. 2005;352:987–996. - PubMed
- Vescovi AL, Galli R, Reynolds BA. Brain tumour stem cells. Nat Rev Cancer. 2006;6:425–436. - PubMed
- Bao S, Wu Q, McLendon RE, Hao Y, Shi Q, Hjelmeland AB, Dewhirst MW, Bigner DD, Rich JN. Glioma stem cells promote radioresistance by preferential activation of the DNA damage response. Nature. 2006;444:756–760. - PubMed
- Groth-Pedersen L, Jaattela M. Combating apoptosis and multidrug resistant cancers by targeting lysosomes. Cancer Lett. 2013 May 28;332:265–74. - PubMed
- Jaattela M. Multiple cell death pathways as regulators of tumour initiation and progression. Oncogene. 2004;23:2746–2756. - PubMed
Publication types
MeSH terms
Substances
LinkOut - more resources
Full Text Sources
Other Literature Sources
Medical
Research Materials
Miscellaneous


