Imputation-based genomic coverage assessments of current human genotyping arrays - PubMed (original) (raw)
Imputation-based genomic coverage assessments of current human genotyping arrays
Sarah C Nelson et al. G3 (Bethesda). 2013.
Abstract
Microarray single-nucleotide polymorphism genotyping, combined with imputation of untyped variants, has been widely adopted as an efficient means to interrogate variation across the human genome. "Genomic coverage" is the total proportion of genomic variation captured by an array, either by direct observation or through an indirect means such as linkage disequilibrium or imputation. We have performed imputation-based genomic coverage assessments of eight current genotyping arrays that assay from ~0.3 to ~5 million variants. Coverage was determined separately in each of the four continental ancestry groups in the 1000 Genomes Project phase 1 release. We used the subset of 1000 Genomes variants present on each array to impute the remaining variants and assessed coverage based on correlation between imputed and observed allelic dosages. More than 75% of common variants (minor allele frequency > 0.05) are covered by all arrays in all groups except for African ancestry, and up to ~90% in all ancestries for the highest density arrays. In contrast, less than 40% of less common variants (0.01 < minor allele frequency < 0.05) are covered by low density arrays in all ancestries and 50-80% in high density arrays, depending on ancestry. We also calculated genome-wide power to detect variant-trait association in a case-control design, across varying sample sizes, effect sizes, and minor allele frequency ranges, and compare these array-based power estimates with a hypothetical array that would type all variants in 1000 Genomes. These imputation-based genomic coverage and power analyses are intended as a practical guide to researchers planning genetic studies.
Keywords: SNP microarrays; genome-wide association study; genomic coverage; power.
Figures
Figure 1
Study design. Schematic of the method used to assess genomic coverage of each array. Throughout the diagram, bold solid lines around boxes indicate observed genotypes (i.e., variant calls from the 1000 Genomes Project phase 1 integrated release, version 3), whereas dashed lines indicate imputed genotypes.
Figure 2
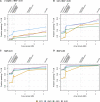
Fraction of variants passing an imputation r2 threshold of 0.8, by MAF bin and ancestry group. The imputation r2 metric plotted here is the squared correlation between imputed and observed allelic dosage in the samples comprising the ancestry group. The y-axis is the proportion of variants (imputed and observed) with imputation r2 ≥ 0.8, restricted to variants with at least two copies of the minor allele in the given ancestry group. The x-axis position of each array corresponds to the number of unique positions assayed by that array (see Table 2, column 5). Thus. the order of the arrays on each axis is as follows: HumanCore, HumanCore+Exome, Axiom Biobank, OmniExpress, Axiom World Array 4, Omni2.5M, Omni2.5M+Exome, and Omni5M. Panel (A) is for variants with at least two copies of the minor allele and MAF ≤ 0.01, (B) for 0.01 < MAF ≤ 0.05, (C) for MAF > 0.01, and (D) for MAF > 0.05.
Figure 3
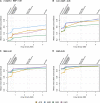
Mean MA concordance, by MAF bin and ancestry group. The y-axis values are mean MA concordance in samples comprising the given ancestry group. MA concordance is defined as the concordance (percent agreement) between observed and most likely imputed genotype, when at least one of those two genotypes contains one or two copies of the minor allele. Variants were restricted to those with at least two copies of the minor allele in the given ancestry group. The x-axis position of each array corresponds to the number of unique positions assayed by that array (see Table 2, column 5). Thus the order of the arrays on each axis is as follows: HumanCore, HumanCore+Exome, Axiom Biobank, OmniExpress, Axiom World Array 4, Omni2.5M, Omni2.5M+Exome, and Omni5M. (A) Variants with at least two copies of the minor allele and MAF ≤ 0.01, (B) for 0.01 < MAF ≤ 0.05, (C) for MAF > 0.01, and (D) for MAF > 0.05.
Figure 4
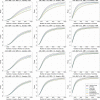
Genome-wide power estimates for GRR values of 1.2, 1.3, and 1.4, for common autosomal variants (MAF > 0.05). The array Omni2.5+Exome is not shown in these plots because it is indistinguishable at this resolution from the Omni2.5M array. In the legend, “1000 Genomes” refers to a hypothetical array in which all variants in the 1000 Genomes dataset would be typed.
Figure 5
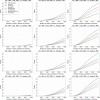
Genome-wide power estimates for GRR values of 1.2, 1.3, and 1.4, for less common autosomal variants (0.01 < MAF ≤ 0.05). The array Omni2.5+Exome is not shown in these plots because it is indistinguishable at this resolution from the Omni2.5M array. In the legend, “1000 Genomes” refers to a hypothetical array in which all variants in the 1000 Genomes dataset would be typed.
Similar articles
- Effect of genome-wide genotyping and reference panels on rare variants imputation.
Zheng HF, Ladouceur M, Greenwood CM, Richards JB. Zheng HF, et al. J Genet Genomics. 2012 Oct 20;39(10):545-50. doi: 10.1016/j.jgg.2012.07.002. Epub 2012 Jul 24. J Genet Genomics. 2012. PMID: 23089364 - A comprehensive evaluation of polygenic score and genotype imputation performances of human SNP arrays in diverse populations.
Nguyen DT, Tran TTH, Tran MH, Tran K, Pham D, Duong NT, Nguyen Q, Vo NS. Nguyen DT, et al. Sci Rep. 2022 Oct 20;12(1):17556. doi: 10.1038/s41598-022-22215-y. Sci Rep. 2022. PMID: 36266455 Free PMC article. - Extent to which array genotyping and imputation with large reference panels approximate deep whole-genome sequencing.
Hanks SC, Forer L, Schönherr S, LeFaive J, Martins T, Welch R, Gagliano Taliun SA, Braff D, Johnsen JM, Kenny EE, Konkle BA, Laakso M, Loos RFJ, McCarroll S, Pato C, Pato MT, Smith AV; NHLBI Trans-Omics for Precision Medicine (TOPMed) Consortium; Boehnke M, Scott LJ, Fuchsberger C. Hanks SC, et al. Am J Hum Genet. 2022 Sep 1;109(9):1653-1666. doi: 10.1016/j.ajhg.2022.07.012. Epub 2022 Aug 17. Am J Hum Genet. 2022. PMID: 35981533 Free PMC article. - Genotype Imputation in Genome-Wide Association Studies.
Naj AC. Naj AC. Curr Protoc Hum Genet. 2019 Jun;102(1):e84. doi: 10.1002/cphg.84. Curr Protoc Hum Genet. 2019. PMID: 31216114 Review. - Alternative Applications of Genotyping Array Data Using Multivariant Methods.
Samuels DC, Below JE, Ness S, Yu H, Leng S, Guo Y. Samuels DC, et al. Trends Genet. 2020 Nov;36(11):857-867. doi: 10.1016/j.tig.2020.07.006. Epub 2020 Aug 6. Trends Genet. 2020. PMID: 32773169 Free PMC article. Review.
Cited by
- High density methylation QTL analysis in human blood via next-generation sequencing of the methylated genomic DNA fraction.
McClay JL, Shabalin AA, Dozmorov MG, Adkins DE, Kumar G, Nerella S, Clark SL, Bergen SE; Swedish Schizophrenia Consortium; Hultman CM, Magnusson PK, Sullivan PF, Aberg KA, van den Oord EJ. McClay JL, et al. Genome Biol. 2015 Dec 23;16:291. doi: 10.1186/s13059-015-0842-7. Genome Biol. 2015. PMID: 26699738 Free PMC article. - Smokescreen: a targeted genotyping array for addiction research.
Baurley JW, Edlund CK, Pardamean CI, Conti DV, Bergen AW. Baurley JW, et al. BMC Genomics. 2016 Feb 27;17:145. doi: 10.1186/s12864-016-2495-7. BMC Genomics. 2016. PMID: 26921259 Free PMC article. - APOE alleles' association with cognitive function differs across Hispanic/Latino groups and genetic ancestry in the study of Latinos-investigation of neurocognitive aging (HCHS/SOL).
Granot-Hershkovitz E, Tarraf W, Kurniansyah N, Daviglus M, Isasi CR, Kaplan R, Lamar M, Perreira KM, Wassertheil-Smoller S, Stickel A, Thyagarajan B, Zeng D, Fornage M, DeCarli CS, González HM, Sofer T. Granot-Hershkovitz E, et al. Alzheimers Dement. 2021 Mar;17(3):466-474. doi: 10.1002/alz.12205. Epub 2020 Nov 6. Alzheimers Dement. 2021. PMID: 33155766 Free PMC article. - Genome-wide association study of right-sided colonic diverticulosis in a Korean population.
Choe EK, Lee JE, Chung SJ, Yang SY, Kim YS, Shin ES, Choi SH, Bae JH. Choe EK, et al. Sci Rep. 2019 May 14;9(1):7360. doi: 10.1038/s41598-019-43692-8. Sci Rep. 2019. PMID: 31089239 Free PMC article. - When Does Choice of Accuracy Measure Alter Imputation Accuracy Assessments?
Ramnarine S, Zhang J, Chen LS, Culverhouse R, Duan W, Hancock DB, Hartz SM, Johnson EO, Olfson E, Schwantes-An TH, Saccone NL. Ramnarine S, et al. PLoS One. 2015 Oct 12;10(10):e0137601. doi: 10.1371/journal.pone.0137601. eCollection 2015. PLoS One. 2015. PMID: 26458263 Free PMC article.
References
- Affymetrix Inc. 2012 Affymetrix introduces axiom biobank arrays for genotyping studies. Available at: http://investor.affymetrix.com/phoenix.zhtml?c=116408&p=irol-newsArticle... Accessed April 30, 2013.
- Barrett J. C., Cardon L. R., 2006. Evaluating coverage of genome-wide association studies. Nat. Genet. 38: 659–662 - PubMed
Publication types
MeSH terms
Grants and funding
- HHSN268201200008C/HL/NHLBI NIH HHS/United States
- HHSN268201200008I/HL/NHLBI NIH HHS/United States
- P01 GM099568/GM/NIGMS NIH HHS/United States
- P01GM099568/GM/NIGMS NIH HHS/United States
LinkOut - more resources
Full Text Sources
Other Literature Sources
Molecular Biology Databases


