Toll-like receptor 2 mediates microglia/brain macrophage MT1-MMP expression and glioma expansion - PubMed (original) (raw)
. 2013 Nov;15(11):1457-68.
doi: 10.1093/neuonc/not115. Epub 2013 Sep 5.
Feng Hu, Min-Chi Ku, Petya B Georgieva, Frank Szulzewsky, Andreas Pohlmann, Sonia Waiczies, Helmar Waiczies, Thoralf Niendorf, Seija Lehnardt, Uwe-Karsten Hanisch, Michael Synowitz, Darko Markovic, Susanne A Wolf, Rainer Glass, Helmut Kettenmann
Affiliations
- PMID: 24014382
- PMCID: PMC3813418
- DOI: 10.1093/neuonc/not115
Toll-like receptor 2 mediates microglia/brain macrophage MT1-MMP expression and glioma expansion
Katyayni Vinnakota et al. Neuro Oncol. 2013 Nov.
Abstract
Background: Glioblastomas are the most aggressive primary brain tumors in humans. Microglia/brain macrophage accumulation in and around the tumor correlates with malignancy and poor clinical prognosis of these tumors. We have previously shown that microglia promote glioma expansion through upregulation of membrane type 1 matrix metalloprotease (MT1-MMP). This upregulation depends on signaling via the Toll-like receptor (TLR) adaptor molecule myeloid differentiation primary response gene 88 (MyD88).
Methods: Using in vitro, ex vivo, and in vivo techniques, we identified TLR2 as the main TLR controlling microglial MT1-MMP expression and promoting microglia-assisted glioma expansion.
Results: The implantation of mouse GL261 glioma cells into TLR2 knockout mice resulted in significantly smaller tumors, reduced MT1-MMP expression, and enhanced survival rates compared with wild-type control mice. Tumor expansion studied in organotypic brain slices depended on both parenchymal TLR2 expression and the presence of microglia. Glioma-derived soluble factors and synthetic TLR2 specific ligands induced MT1-MMP expression in microglia from wild-type mice, but no such change in MT1-MMP gene expression was observed in microglia from TLR2 knockout mice. We also found evidence that TLR1 and TLR6 cofunction with TLR2 as heterodimers in regulating MT1-MMP expression in vitro.
Conclusions: Our results thus show that activation of TLR2 along with TLRs 1 and/or 6 converts microglia into a glioma supportive phenotype.
Keywords: MT1-MMP; TLR; glioma; glioma-associated microglia/brain macrophages.
Figures
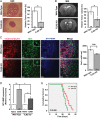
Fig. 1.
Absence of TLR2 results in reduced tumor expansion, decrease in MT1-MMP expression, and increased survival. (A) Deletion of the TLR2 gene locus impacts tumor expansion in vivo. Mouse GL261 cells were i.c. implanted into WT and TLR2 KO mice. The images on the left show H&E stained slices from glioma-bearing WT and TLR2 KO mice. On the right, the relative tumor volume in WT versus TLR2 KO animals was evaluated based on unbiased stereology. Scale bar is 500 μm . (B) A representative MRI T2-weighted image of a hyperintense tumor (delineated by dotted black circle) from WT and TLR2 KO mice. The relative tumor volume in WT and TLR2 KO mice is shown on the right. Statistical significance was analyzed by Wilcoxon's rank-sum test and significance was taken at P < .05(*) and P < .01(**). The significance is indicated in the bars. (C) Slices from glioma inoculated WT and TLR2 KO mice were immunohistologically labeled. Glioma cells were identified by stable expression of mCherry, microglia/brain macrophages by the expression of Iba1, and MT1-MMP by immunolabeling. The insets illustrate the morphology of GAMs in WT and TLR2 KO mice. While WT GAMs had ameboid morphology, GAMs in the TLR2 KO mouse were more ramified. Scale bars are 50 μm and 10 μm (for insets). The GAM cell density near the invasive edge of glioma is shown in the graph on the right. (D) WT and TLR2 KO mice were i.c. implanted with glioma tumors, and GAMs were isolated 14 days after glioma cell injection. Naïve tumor-free brain was used as a control. Data were collected from 3 different mice in each group. Differences in MT1-MMP gene expression were analyzed by 2(−ΔΔCT) method. MT1-MMP gene expression in WT GAMs is 4.08-fold upregulated (±0.204, P = .002) compared with WT naïve microglia, while in TLR2 KO GAMs, MT1-MMP gene expression was 2.19-fold upregulated (±0.26, P = .02). MT1-MMP gene expression in TLR2 KO GAMs is significantly decreased compared with WT GAMs (P = .045). Statistical significance was analyzed by Student's _t_-test and significance was taken at P < .05(*) and P < .01(**). (E) The Kaplan–Meier curves represent the cumulative survival of WT and TLR2 KO mice after glioma cell injection (P = .006).
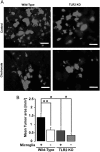
Fig. 2.
TLR2 interferes with glioma growth ex vivo. TLR2 expressed by microglia contributes to glioma expansion in organotypic brain slices. Brain slices from 16-day-old WT and TLR2 KO mice were implanted with 5000 EGFP-GL261 glioma cells, and the area occupied by glioma cells was measured after 5 days. (A) The fluorescence micrograph of EGFP-labeled glioma cells in both microglia-containing and -depleted brain slices for WT (left) and TLR2 KO (right) mice. Scale bar is 10 μM. (B) Tumor area was quantified in both microglia-containing (+) and -depleted (−) slices from WT and TLR2 KO mice. Statistical significance was analyzed by Wilcoxon's rank-sum test and significance was taken at P < .05(*) and P < .01(**).
Fig. 3.
TLR agonists differentially regulate microglial MT1-MMP gene expression but do not alter chemotaxis in microglia. (A) The influence of subtype-specific ligands of TLRs on MT1-MMP gene expression was determined in primary microglia from WT mice. Microglia were stimulated with agonists and GCM for 6 h and differences in MT1-MMP gene expression were analyzed by the 2(−ΔΔCT) method. (B) Microglia were stimulated with TLR2-specific agonists PG-LPS and HKLM for 6 h, which showed a significant induction of MT1-MMP gene expression. Statistical significance was analyzed by Mann–Whitney _U_-test and significance was taken at P < .05(*) and P < .01(**). (C) The impact of the TLR2 agonists Pam3CSK4, PG-LPS, and HKLM on microglial chemotaxis was determined in a 48-well microchemotaxis chamber. ATP was used as a positive control. No significant differences were observed in microglia migration between the control group (only DMEM) and TLR2 agonists group after 6 h of incubation.
Fig. 4.
MT1-MMP gene expression induced by GCM in microglia from different TLR-deficient mice. (A) Microglia from WT and TLR2 KO mice were stimulated with GCM for 6 h and MT1-MMP gene expression was analyzed by real-time qPCR and compared with an unstimulated control. Similarly, MT1-MMP gene expression was analyzed in (B) TLR1, (C) TLR6, (D) TLR7, and (E) TLR9 KO mice. (F) A representative western blot image of MT1-MMP protein expression in GCM-stimulated microglial cells from TLR2 KO and WT control. MT1-MMP expression is reduced in TLR2 KO microglia, as seen in the quantification of the western blot (values indicated below the bands).
Similar articles
- Glioma-derived versican promotes tumor expansion via glioma-associated microglial/macrophages Toll-like receptor 2 signaling.
Hu F, Dzaye O, Hahn A, Yu Y, Scavetta RJ, Dittmar G, Kaczmarek AK, Dunning KR, Ricciardelli C, Rinnenthal JL, Heppner FL, Lehnardt S, Synowitz M, Wolf SA, Kettenmann H. Hu F, et al. Neuro Oncol. 2015 Feb;17(2):200-10. doi: 10.1093/neuonc/nou324. Epub 2014 Dec 1. Neuro Oncol. 2015. PMID: 25452390 Free PMC article. - Gliomas induce and exploit microglial MT1-MMP expression for tumor expansion.
Markovic DS, Vinnakota K, Chirasani S, Synowitz M, Raguet H, Stock K, Sliwa M, Lehmann S, Kälin R, van Rooijen N, Holmbeck K, Heppner FL, Kiwit J, Matyash V, Lehnardt S, Kaminska B, Glass R, Kettenmann H. Markovic DS, et al. Proc Natl Acad Sci U S A. 2009 Jul 28;106(30):12530-5. doi: 10.1073/pnas.0804273106. Epub 2009 Jul 15. Proc Natl Acad Sci U S A. 2009. PMID: 19617536 Free PMC article. - Glioma-associated microglial MMP9 expression is upregulated by TLR2 signaling and sensitive to minocycline.
Hu F, Ku MC, Markovic D, Dzaye O, Lehnardt S, Synowitz M, Wolf SA, Kettenmann H. Hu F, et al. Int J Cancer. 2014 Dec 1;135(11):2569-78. doi: 10.1002/ijc.28908. Epub 2014 May 9. Int J Cancer. 2014. PMID: 24752463 Free PMC article. - Association of TLR1, TLR2, TLR4, TLR6, and TIRAP polymorphisms with disease susceptibility.
Noreen M, Arshad M. Noreen M, et al. Immunol Res. 2015 Jun;62(2):234-52. doi: 10.1007/s12026-015-8640-6. Immunol Res. 2015. PMID: 25784622 Review. - An Update on Toll-like Receptor 2, Its Function and Dimerization in Pro- and Anti-Inflammatory Processes.
Colleselli K, Stierschneider A, Wiesner C. Colleselli K, et al. Int J Mol Sci. 2023 Aug 5;24(15):12464. doi: 10.3390/ijms241512464. Int J Mol Sci. 2023. PMID: 37569837 Free PMC article. Review.
Cited by
- A gene expression-based study on immune cell subtypes and glioma prognosis.
Zhong QY, Fan EX, Feng GY, Chen QY, Gou XX, Yue GJ, Zhang GH. Zhong QY, et al. BMC Cancer. 2019 Nov 15;19(1):1116. doi: 10.1186/s12885-019-6324-7. BMC Cancer. 2019. PMID: 31729963 Free PMC article. - Immune biology of glioma-associated macrophages and microglia: functional and therapeutic implications.
Wei J, Chen P, Gupta P, Ott M, Zamler D, Kassab C, Bhat KP, Curran MA, de Groot JF, Heimberger AB. Wei J, et al. Neuro Oncol. 2020 Feb 20;22(2):180-194. doi: 10.1093/neuonc/noz212. Neuro Oncol. 2020. PMID: 31679017 Free PMC article. Review. - HMGB1-Induced p62 Overexpression Promotes Snail-Mediated Epithelial-Mesenchymal Transition in Glioblastoma Cells via the Degradation of GSK-3β.
Li H, Li J, Zhang G, Da Q, Chen L, Yu S, Zhou Q, Weng Z, Xin Z, Shi L, Ma L, Huang A, Qi S, Lu Y. Li H, et al. Theranostics. 2019 Mar 16;9(7):1909-1922. doi: 10.7150/thno.30578. eCollection 2019. Theranostics. 2019. PMID: 31037147 Free PMC article. - Advancing Cardiovascular, Neurovascular, and Renal Magnetic Resonance Imaging in Small Rodents Using Cryogenic Radiofrequency Coil Technology.
Niendorf T, Pohlmann A, Reimann HM, Waiczies H, Peper E, Huelnhagen T, Seeliger E, Schreiber A, Kettritz R, Strobel K, Ku MC, Waiczies S. Niendorf T, et al. Front Pharmacol. 2015 Nov 12;6:255. doi: 10.3389/fphar.2015.00255. eCollection 2015. Front Pharmacol. 2015. PMID: 26617515 Free PMC article. Review. - Considerations for modelling diffuse high-grade gliomas and developing clinically relevant therapies.
Higginbottom SL, Tomaskovic-Crook E, Crook JM. Higginbottom SL, et al. Cancer Metastasis Rev. 2023 Jun;42(2):507-541. doi: 10.1007/s10555-023-10100-7. Epub 2023 Apr 1. Cancer Metastasis Rev. 2023. PMID: 37004686 Free PMC article. Review.
References
- Ohgaki H, Kleihues P. Epidemiology and etiology of gliomas. Acta Neuropathol. 2005;109(1):93–108. - PubMed
- Alves TR, Lima FR, Kahn SA, et al. Glioblastoma cells: a heterogeneous and fatal tumor interacting with the parenchyma. Life Sci. 2011;89(15–16):532–539. - PubMed
- Charles NA, Holland EC, Gilbertson R, Glass R, Kettenmann H. The brain tumor microenvironment. Glia. 2011;59(8):1169–1180. - PubMed
- Kettenmann H, Hanisch UK, Noda M, Verkhratsky A. Physiology of microglia. Physiol Rev. 2011;91(2):461–553. - PubMed
Publication types
MeSH terms
Substances
LinkOut - more resources
Full Text Sources
Other Literature Sources
Medical
Molecular Biology Databases


