Simultaneous detection of hepatitis C virus and interferon stimulated gene expression in infected human liver - PubMed (original) (raw)
. 2014 Jun;59(6):2121-30.
doi: 10.1002/hep.26770. Epub 2014 Apr 25.
Affiliations
- PMID: 24122862
- PMCID: PMC3975814
- DOI: 10.1002/hep.26770
Simultaneous detection of hepatitis C virus and interferon stimulated gene expression in infected human liver
Stefan Wieland et al. Hepatology. 2014 Jun.
Abstract
Approximately 50% of patients with chronic hepatitis C (CHC) have ongoing expression of interferon stimulated genes (ISGs) in the liver. It is unclear why this endogenous antiviral response is inefficient in eradicating the infection. Several viral escape strategies have been identified in vitro, including inhibition of interferon (IFN) induction and ISG messenger RNA (mRNA) translation. The in vivo relevance of these mechanisms is unknown, because reliable methods to identify hepatitis C virus (HCV)-infected cells in human liver are lacking. We developed a highly sensitive in situ hybridization (ISH) system capable of HCV RNA and ISG mRNA detection in human liver biopsies and applied it to study the interaction of HCV with the endogenous IFN system. We simultaneously monitored HCV RNA and ISG mRNA using HCV isolate- and ISG mRNA-specific probes in liver biopsy sections from 18 CHC patients. The signals were quantified at the single-cell resolution in a series of random high-power fields. The proportion of infected hepatocytes ranged from 1%-54% and correlated with viral load, but not with HCV genotype or ISG expression. Infected cells occurred in clusters, pointing to cell-to-cell spread as the predominant mode of HCV transmission. ISG mRNAs were readily detected in HCV-infected cells, challenging previously proposed mechanisms of viral interference with the immune system. Conversely, infected cells and neighboring cells showed increased ISG mRNA levels, demonstrating that the stimulus driving ISG expression originates from HCV-infected hepatocytes.
Conclusion: HCV infection in human hepatocytes during CHC does not efficiently interfere with IFN induction, IFN signaling, or transcription of ISG mRNA.
© 2014 by the American Association for the Study of Liver Diseases.
Figures
Figure 1. In situ HCV RNA detection in human liver tissue across a range of serum viral loads
A–C) Single-color HCV RNA detection by ISH in patients with high (A, 5’754’399 IU/ml), middle (B, 707’946 IU/ml), and low (C, 87’096 IU/ml) serum viral load. D) Liver sample from an HCV-negative patient (–CT) stained with probe set directed against B271 HCV isolate. Biopsy numbers are shown in the top right corners. The size of the bar is 25 µm.
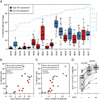
Figure 2. HCV infected cells occur in clusters in human liver tissue and their numbers correlate with serum viral load
A) Boxplot showing the percentage of liver cells positive for HCV RNA in 18 patients. Patients with high ISG expression in the liver (pSVR ≤ 0.5) are shown in red and patients with low ISG expression (pSVR > 0.5) in blue. Percentage of HCV-positive cells was calculated based on the number of cells harboring at least one signal dot of HCV RNA staining in the single-color detection divided by the total number of cells counted. Each dot represents the proportion of infected cells in one randomly chosen image. For every patient, data from one to three independently stained liver biopsy sections are pooled. The blue line shows log10 serum viral load expressed in IU/ml. B) Percentage of liver cells positive for HCV RNA is associated with serum viral load. Association between the variables was evaluated using Spearman’s rank correlation coefficient (rho). Patients with high ISG expression in the liver (pSVR ≤ 0.5) are shown in red and patients with low ISG expression (pSVR > 0.5) in blue. C) Percentage of liver cells positive for HCV RNA is associated with the mean number of HCV signal dots per infected cell. Association between the variables was evaluated using Spearman’s rank correlation coefficient (rho). Patients with high ISG expression in the liver (pSVR ≤ 0.5) are shown in red and patients with low ISG expression (pSVR > 0.5) in blue. D) Infected cells are more likely to have infected neighbors than non-infected cells. Each dot shows the proportion of cells that have at least one HCV-positive adjacent neighbor. Lines connect measurements from the same patient. HCV−: non-infected cells; HCV+: infected cells; HCV++: infected cells which harbor more than two HCV signal dots. P values were calculated using paired two-tailed Student’s t-test.
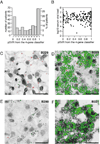
Figure 3. Extent of ISG induction in HCV patients does not correlate with serum viral load or percentage of infected cells
A) Distribution of SVR probabilities calculated according to the 4-gene classifier(14) in a sample of 246 chronic hepatitis C patients. B) There is no association of serum viral load with probability of SVR calculated according to the 4-gene classifier in a sample of 221 chronic hepatitis C patients (for 25 patients with known pSVR the serum viral load was not available). C–F) Representative examples of 2-color ISH staining for HCV RNA (in red) and IFI27 mRNA (in green) in patients with: (C) low expression levels of IFI27 (0.084 relative to GAPDH) and high viral load (831’762 IU/ml); (D) high expression levels of IFI27 (1.8 relative to GAPDH) and high viral load (2’818’383 IU/ml); (E) low expression levels of IFI27 (0.28 relative to GAPDH) and low viral load (46’773 IU/ml); (F) high expression levels of IFI27 (2.3 relative to GAPDH) and low viral load (87’096 IU/ml). Biopsy numbers are shown in the top right corners. The size of the bar is 25 µm.
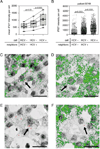
Figure 4. HCV infected cells and their neighbors have increased probability of high ISG expression compared to non-infected cells
A) Mean integrated intensity of IFI27 mRNA ISH staining per cell in the six patients with high expression of hepatic ISGs (pSVR ≤ 0.5) for whom double-color staining was available (B631, B749, B339, B333, B321 and B827). Every cell from each patient was grouped into one of the three categories: (i) uninfected cells without any infected adjacent neighbors, (ii) uninfected cells with at least one infected adjacent neighbor, (iii) infected cells; and the average integrated intensity of IFI27 mRNA staining per cell in each category was calculated. Lines connect measurements from the same patient. P values were calculated using paired two-tailed Student’s t-test. B) Integrated intensity of IFI27 mRNA ISH staining per cell in a selected patient with induced ISG expression (B749). Each cell was grouped into one of the three categories: (i) uninfected cells without any infected adjacent neighbors, (ii) uninfected cells with at least one infected adjacent neighbor, (iii) infected cells. P values were calculated using two-tailed Student’s t-test. C–F) Selected images of 2-color ISH staining for HCV RNA (in red) and IFI27 (green) mRNA in the liver biopsy from one representative patient (B749) with induced ISGs. The arrows indicate examples of different HCV-ISG localization patterns: (C) co-localization of HCV RNA signal dots with high levels of IFI27 mRNA in the same cell; (D) high levels of IFI27 mRNA despite the lack of HCV RNA positive cells in direct proximity; (E) very weak IFI27 signals in HCV infected cells and neighboring non-infected cells; (F) very weak IFI27 signals in an HCV-infected cell and strong IFI27 signals in surrounding cells (both HCV-negative and HCV-positive). The size of the bar is 25 µm.
Comment in
- Defining the spatial relationship between hepatitis C virus infection and interferon-stimulated gene induction in the human liver.
Horner SM. Horner SM. Hepatology. 2014 Jun;59(6):2065-7. doi: 10.1002/hep.26960. Epub 2014 Apr 14. Hepatology. 2014. PMID: 24375835 No abstract available.
Similar articles
- Use of laser capture microdissection to map hepatitis C virus-positive hepatocytes in human liver.
Kandathil AJ, Graw F, Quinn J, Hwang HS, Torbenson M, Perelson AS, Ray SC, Thomas DL, Ribeiro RM, Balagopal A. Kandathil AJ, et al. Gastroenterology. 2013 Dec;145(6):1404-13.e1-10. doi: 10.1053/j.gastro.2013.08.034. Epub 2013 Aug 22. Gastroenterology. 2013. PMID: 23973767 Free PMC article. - Hepatitis C virus-mediated enhancement of microRNA miR-373 impairs the JAK/STAT signaling pathway.
Mukherjee A, Di Bisceglie AM, Ray RB. Mukherjee A, et al. J Virol. 2015 Mar;89(6):3356-65. doi: 10.1128/JVI.03085-14. Epub 2015 Jan 14. J Virol. 2015. PMID: 25589644 Free PMC article. - Class A scavenger receptor 1 (MSR1) restricts hepatitis C virus replication by mediating toll-like receptor 3 recognition of viral RNAs produced in neighboring cells.
Dansako H, Yamane D, Welsch C, McGivern DR, Hu F, Kato N, Lemon SM. Dansako H, et al. PLoS Pathog. 2013;9(5):e1003345. doi: 10.1371/journal.ppat.1003345. Epub 2013 May 23. PLoS Pathog. 2013. PMID: 23717201 Free PMC article. - Innate and adaptive immune responses in HCV infections.
Heim MH, Thimme R. Heim MH, et al. J Hepatol. 2014 Nov;61(1 Suppl):S14-25. doi: 10.1016/j.jhep.2014.06.035. Epub 2014 Nov 3. J Hepatol. 2014. PMID: 25443342 Review. - Innate immunity and HCV.
Heim MH. Heim MH. J Hepatol. 2013 Mar;58(3):564-74. doi: 10.1016/j.jhep.2012.10.005. Epub 2012 Oct 11. J Hepatol. 2013. PMID: 23063572 Review.
Cited by
- Impairment of type I but not type III IFN signaling by hepatitis C virus infection influences antiviral responses in primary human hepatocytes.
Friborg J, Ross-Macdonald P, Cao J, Willard R, Lin B, Eggers B, McPhee F. Friborg J, et al. PLoS One. 2015 Mar 31;10(3):e0121734. doi: 10.1371/journal.pone.0121734. eCollection 2015. PLoS One. 2015. PMID: 25826356 Free PMC article. - Lipoprotein Receptors Redundantly Participate in Entry of Hepatitis C Virus.
Yamamoto S, Fukuhara T, Ono C, Uemura K, Kawachi Y, Shiokawa M, Mori H, Wada M, Shima R, Okamoto T, Hiraga N, Suzuki R, Chayama K, Wakita T, Matsuura Y. Yamamoto S, et al. PLoS Pathog. 2016 May 6;12(5):e1005610. doi: 10.1371/journal.ppat.1005610. eCollection 2016 May. PLoS Pathog. 2016. PMID: 27152966 Free PMC article. - Immune responses and immunopathology in acute and chronic viral hepatitis.
Shin EC, Sung PS, Park SH. Shin EC, et al. Nat Rev Immunol. 2016 Aug;16(8):509-23. doi: 10.1038/nri.2016.69. Epub 2016 Jul 4. Nat Rev Immunol. 2016. PMID: 27374637 Review. - Limited hepatitis B virus replication space in the chronically hepatitis C virus-infected liver.
Wieland SF, Asabe S, Engle RE, Purcell RH, Chisari FV. Wieland SF, et al. J Virol. 2014 May;88(9):5184-8. doi: 10.1128/JVI.03553-13. Epub 2014 Feb 12. J Virol. 2014. PMID: 24522924 Free PMC article. - Interferon-free treatment for hepatitis C virus infection induces normalization of extrahepatic type I interferon signaling.
Sung PS, Lee EB, Park DJ, Lozada A, Jang JW, Bae SH, Choi JY, Yoon SK. Sung PS, et al. Clin Mol Hepatol. 2018 Sep;24(3):302-310. doi: 10.3350/cmh.2017.0074. Epub 2018 Mar 12. Clin Mol Hepatol. 2018. PMID: 29526079 Free PMC article.
References
- Seeger C. Salient molecular features of hepatitis C virus revealed. Trends in Microbiology. 2005;13:528–534. - PubMed
- Foy E, Li K, Wang C, Sumpter R, Jr, Ikeda M, Lemon SM, Gale M., Jr Regulation of interferon regulatory factor-3 by the hepatitis C virus serine protease. Science. 2003;300:1145–1148. - PubMed
- Meylan E, Curran J, Hofmann K, Moradpour D, Binder M, Bartenschlager R, Tschopp J. Cardif is an adaptor protein in the RIG-I antiviral pathway and is targeted by hepatitis C virus. Nature. 2005;437:1167–1172. - PubMed
Publication types
MeSH terms
Substances
Grants and funding
- R01 AI079043/AI/NIAID NIH HHS/United States
- U19 AI088778/AI/NIAID NIH HHS/United States
- R01-AI079043/AI/NIAID NIH HHS/United States
- U19-AI088778/AI/NIAID NIH HHS/United States
LinkOut - more resources
Full Text Sources
Other Literature Sources
Medical


