Cumulative haploinsufficiency and triplosensitivity drive aneuploidy patterns and shape the cancer genome - PubMed (original) (raw)
Cumulative haploinsufficiency and triplosensitivity drive aneuploidy patterns and shape the cancer genome
Teresa Davoli et al. Cell. 2013.
Abstract
Aneuploidy has been recognized as a hallmark of cancer for more than 100 years, yet no general theory to explain the recurring patterns of aneuploidy in cancer has emerged. Here, we develop Tumor Suppressor and Oncogene (TUSON) Explorer, a computational method that analyzes the patterns of mutational signatures in tumors and predicts the likelihood that any individual gene functions as a tumor suppressor (TSG) or oncogene (OG). By analyzing >8,200 tumor-normal pairs, we provide statistical evidence suggesting that many more genes possess cancer driver properties than anticipated, forming a continuum of oncogenic potential. Integrating our driver predictions with information on somatic copy number alterations, we find that the distribution and potency of TSGs (STOP genes), OGs, and essential genes (GO genes) on chromosomes can predict the complex patterns of aneuploidy and copy number variation characteristic of cancer genomes. We propose that the cancer genome is shaped through a process of cumulative haploinsufficiency and triplosensitivity.
Copyright © 2013 Elsevier Inc. All rights reserved.
Figures
Fig. 1. Prediction of TSGs and OGs based on their mutation profile patterns
A) Schematic representation of our method for the detection of cancer driver genes based on the assessment of the overall mutational profile of each gene as compared to the average profile found in neutral genes. The somatic mutations in each gene from all tumor samples are combined and classified based on their predicted functional impact. The main classes of mutations (silent, missense and LOF) are depicted. B) Schematic depicting the most important features of the distributions of mutation types expected for a typical TSG, OG and Neutral gene. Compared to a ‘neutral’ gene, TSGs are expected to display a higher level of inactivating mutations compared to their background mutation rate (benign mutations) and OGs are expected to display a higher level of activating missense mutations and a characteristic pattern of recurrent missense mutations in specific residues. C) A flowchart delineating the main steps in our method for identifying predictive parameters for TSGs and OGs from the classification of mutations based on their functional impact through Lasso, and the use of these selected parameters for the prediction of TSGs and OGs by TUSON Explorer (or the Lasso method). D) Schematics related to (C) depicting the main parameters of the mutation profiling method employed by TUSON Explorer for the prediction of TSGs and OGs (HiFI: High Functional Impact). For TSGs, the parameters are the LOF/Benign ratio, the HiFI/Benign ratio and the Splicing/Benign ratio, while for OGs they are the Entropy score and the HiFI/Benign ratio. Also see Supp. Fig. 1 and Supp. Table 1.
Fig. 2. Best parameters selected by Lasso for the prediction of TSGs and OGs
Panels A–C contain a boxplot representation of the distribution of the values for the indicated parameters in the indicated Neutral genes (grey), TSG training set (red) and OG training set (green). The median, first quartile, third quartile and outliers in the distribution are shown. The p-value for the difference in the two indicated distributions is shown as derived by the Wilcoxon test. A) Boxplots showing the distribution of LOF/Benign, HiFI missense/Benign, Splicing/Benign ratios and the high frequency of focal deletion among the Neutral gene set and the TSG. B) Boxplots showing the distribution of Missense Entropy, HiFI missense/Benign, mean of PolyPhen2 score and the high frequency of focal amplification among the Neutral gene set and the OGs. C) Boxplots showing the distribution of LOF/Benign, Splicing/Benign ratios, high-frequency of deletion and high frequency of amplification among the TSG and OG sets. D) Plot of the LOF/Benign ratio and Missense Entropy for each gene, the best parameters for discriminating between TSGs and OGs. Specific genes with high levels of LOF/Benign or Entropy Missense are shown along with their p-value for being a TSG or an OG (TUSON Explorer). Also see Supp. Fig. 2 and Supp. Table 2.
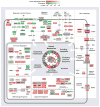
Fig. 3. Representation of predicted TSGs and OGs within their cellular pathways
Placement of predicted cancer drivers within specific cellular pathways. TSGs and OGs were predicted by TUSON Explorer and ranked by their associated combined q values. The predicted TSGs and OGs belonging to many known cellular pathways or complexes are shown and how they generally correspond to the hallmarks of cancer. TSGs are shown in red while OGs are shown in green and the color intensity is proportional to the combined q value as indicated. For some pathways, additional genes absent from the predicted TSGs and OGs were added and marked in grey for clarity of the pathway representation. While several genes are known to affect multiple pathways and hallmarks, only one function is presented for the sake of limiting the complexity of the diagram. An external black box outside the colored gene box highlights genes previously less well characterized for their roles in tumorigenesis. Also see Supp. Fig. 3 and Supp. Table 3.
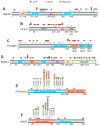
Fig. 4. Representation of mutation patterns in representative predicted TSGs and OGs
The mutational pattern of selected TSGs and OGs are depicted. For TSGs (A–D), the locations of LOF (red) and Silent (white) mutations within the coding regions are shown. For OGs (E–F), the location of recurrent Missense (orange) and LOF (red) mutations within the coding regions is shown. USP28, TP53BP1 and RASA1 are previously less well-characterized candidate TSGs in the TUSON PAN-Cancer analysis. SPOP and PPP2R1A are previously less-well characterized candidate OGs. Also see Supp. Table 3.
Fig. 5. Behavior of Functional Gene Sets Relative to TSG Parameters
Panels A–B contain a boxplot representation of the distribution of the values for the indicated parameters in the Neutral genes compared with the Essential genes and STOP genes. The median, first quartile third quartile and outliers in the distribution are shown. The p-value for the difference in the two indicated distributions is shown as derived by the Wilcoxon test. A) Boxplots showing the distribution of LOF/Silent, LOF/Kb, HiFI missense/Benign ratios and the high frequency of focal deletion among the Neutral gene set and the Essential genes. B) Boxplots showing the distribution of LOF/Silent, Splicing/Benign, HiFI missense/Benign, ratios and the high frequency of focal deletion among the Neutral gene and STOP gene sets. Also see Supp. Table 5.
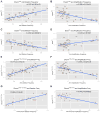
Fig. 6. Charm score, Chrom score and copy number alterations: correlation analysis
The correlation analysis (Pearson’s correlation) of the Charm scores for TSGs (CharmTSG, A–B), OGs (CharmOG, C), essential genes (CharmEss, D) and combinations of these classes (CharmTSG-OG-Ess and CharmTSG-OG, E–F) and the corresponding Chrom scores (ChromTSG-OG and ChromTSG-OG-Ess, G–H) in relationship to the arm- or chromosome-level deletion or amplification frequency. The Charm scores refer to a weighted density of TSGs, OGs or essential genes present on each chromosome arm, where each gene is weighted based on its rank position within the list of predicted TSGs and OGs ranked by TUSON Explorer. The Chrom score is the equivalent of the Charm score for whole chromosome SCNAs. Also see Supp. Figs. 4&5 and Supp. Table 6.
Fig. 7. Cumulative haploinsufficiency and triplosensitivity shape the cancer genome
Illustrative schematics of different concepts highlighted in the Discussion. A) The phenotypic continuum of cancer driver. B) The cancer gene island model for focal SCNAs. C) The cumulative gene dosage balance model for predicting the patterns of aneuploidy. D) Comparison of the predictions of Knudson’s Two-hit Hypothesis for TSGs compared the Haploinsufficiency Hypothesis presented in this study.
Similar articles
- Somatic selection distinguishes oncogenes and tumor suppressor genes.
Chandrashekar P, Ahmadinejad N, Wang J, Sekulic A, Egan JB, Asmann YW, Kumar S, Maley C, Liu L. Chandrashekar P, et al. Bioinformatics. 2020 Mar 1;36(6):1712-1717. doi: 10.1093/bioinformatics/btz851. Bioinformatics. 2020. PMID: 32176769 Free PMC article. - SWAN pathway-network identification of common aneuploidy-based oncogenic drivers.
Bowers RR, Jones CM, Paz EA, Barrows JK, Armeson KE, Long DT, Delaney JR. Bowers RR, et al. Nucleic Acids Res. 2022 Apr 22;50(7):3673-3692. doi: 10.1093/nar/gkac200. Nucleic Acids Res. 2022. PMID: 35380699 Free PMC article. - [Oncogenes, tumor suppressor genes, and aneuploidy: the sum of the nuances].
Blay JY. Blay JY. Bull Cancer. 2014 Apr;101(4):340. Bull Cancer. 2014. PMID: 24918235 French. No abstract available. - Aneuploidy, the somatic mutation that makes cancer a species of its own.
Duesberg P, Rasnick D. Duesberg P, et al. Cell Motil Cytoskeleton. 2000 Oct;47(2):81-107. doi: 10.1002/1097-0169(200010)47:2<81::AID-CM1>3.0.CO;2-#. Cell Motil Cytoskeleton. 2000. PMID: 11013390 Review. - New Insight into microRNA Functions in Cancer: Oncogene-microRNA-Tumor Suppressor Gene Network.
Zhou K, Liu M, Cao Y. Zhou K, et al. Front Mol Biosci. 2017 Jul 7;4:46. doi: 10.3389/fmolb.2017.00046. eCollection 2017. Front Mol Biosci. 2017. PMID: 28736730 Free PMC article. Review.
Cited by
- STRIPAK components determine mode of cancer cell migration and metastasis.
Madsen CD, Hooper S, Tozluoglu M, Bruckbauer A, Fletcher G, Erler JT, Bates PA, Thompson B, Sahai E. Madsen CD, et al. Nat Cell Biol. 2015 Jan;17(1):68-80. doi: 10.1038/ncb3083. Epub 2014 Dec 22. Nat Cell Biol. 2015. PMID: 25531779 Free PMC article. - Aneuploidy as a driver of human cancer.
Sdeor E, Okada H, Saad R, Ben-Yishay T, Ben-David U. Sdeor E, et al. Nat Genet. 2024 Oct;56(10):2014-2026. doi: 10.1038/s41588-024-01916-2. Epub 2024 Oct 2. Nat Genet. 2024. PMID: 39358600 Review. - Technical comparison of Abbott's UroVysion® and Biocare's CytoFISH urine fluorescence in situ hybridization (FISH) assays.
Anderson T, Hartman S, Dunn W, Bellin H, Ehlers TW, Groen S, Ramos JA. Anderson T, et al. Cancer Cell Int. 2023 Dec 8;23(1):314. doi: 10.1186/s12935-023-03156-6. Cancer Cell Int. 2023. PMID: 38066541 Free PMC article. - Too much to handle - how gaining chromosomes destabilizes the genome.
Passerini V, Storchová Z. Passerini V, et al. Cell Cycle. 2016 Nov;15(21):2867-2874. doi: 10.1080/15384101.2016.1231285. Epub 2016 Sep 16. Cell Cycle. 2016. PMID: 27636196 Free PMC article. Review. - SSCI: Self-Supervised Deep Learning Improves Network Structure for Cancer Driver Gene Identification.
Xu J, Hao J, Liao X, Shang X, Li X. Xu J, et al. Int J Mol Sci. 2024 Sep 26;25(19):10351. doi: 10.3390/ijms251910351. Int J Mol Sci. 2024. PMID: 39408682 Free PMC article.
References
Publication types
MeSH terms
Grants and funding
- K08 DK081612/DK/NIDDK NIH HHS/United States
- R01 GM044664/GM/NIGMS NIH HHS/United States
- T32 GM007753/GM/NIGMS NIH HHS/United States
- K08DK081612/DK/NIDDK NIH HHS/United States
- U54 LM008748/LM/NLM NIH HHS/United States
- U54LM008748/LM/NLM NIH HHS/United States
- WT_/Wellcome Trust/United Kingdom
LinkOut - more resources
Full Text Sources
Other Literature Sources
Miscellaneous


