Arrayed BUB recruitment modules in the kinetochore scaffold KNL1 promote accurate chromosome segregation - PubMed (original) (raw)
Arrayed BUB recruitment modules in the kinetochore scaffold KNL1 promote accurate chromosome segregation
Mathijs Vleugel et al. J Cell Biol. 2013.
Abstract
Fidelity of chromosome segregation relies on coordination of chromosome biorientation and the spindle checkpoint. Central to this is the kinetochore scaffold KNL1 that integrates the functions of various mitotic regulators including BUB1 and BUBR1. We show that KNL1 contains an extensive array of short linear sequence modules that encompass TxxΩ and MELT motifs and that can independently localize BUB1. Engineered KNL1 variants with few modules recruit low levels of BUB1 to kinetochores but support a robust checkpoint. Increasing numbers of modules concomitantly increase kinetochore BUB1 levels and progressively enhance efficiency of chromosome biorientation. Remarkably, normal KNL1 function is maintained by replacing all modules with a short array of naturally occurring or identical, artificially designed ones. A minimal array of generic BUB recruitment modules in KNL1 thus suffices for accurate chromosome segregation. Widespread divergence in the amount and sequence of these modules in KNL1 homologues may represent flexibility in adapting regulation of mitotic processes to altered requirements for chromosome segregation during evolution.
Figures
Figure 1.
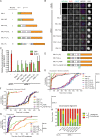
The N-terminal MDLT-KI module in KNL1 independently recruits BUB proteins. (A) Immunolocalization of BUB1 (left panels, red) and BUBR1 (right panels, red) in LacI-LAP-KNL11–261–transfected, nocodazole-treated U2OS-LacO cells. LacI-LAP-KNL11–261 is shown in green and DNA (DAPI) is in blue. Insets show magnifications of the boxed regions. KNL1KI1 denotes LacI-LAP-KNL11–261 in which KIDTTSF is mutated to KIDATSA, KNL1KI2 is KIDFNDF mutated to KIDANDA, and KNL1MDLT mutated is MDLT to MDLA. Bars, 5 µm (insets, 0.5 µm). (B–D) Representative images (B and C) and quantification (D) of LAP-KNL1–expressing Flp-in HeLa cells transfected with siRNAs to luciferase (siLUC) or to KNL1 (siKNL1) and treated with nocodazole. LAP-KNL1 is shown in green, BUB proteins in red, centromeres (CREST) in blue, and DNA (DAPI) in white. Bars, 5 µm. Quantification in D shows total kinetochore signal intensity (+SD) of LAP-KNL1 and BUB proteins over CREST. Data are from >15 cells and representative of 3 experiments. Levels of kinetochore BUBs in control cells and of kinetochore LAP-KNL1 in KNL1-FL–expressing cells are set to 1.
Figure 2.
The N-terminal MDLT-KI module in KNL1 is sufficient to support SAC activity but not chromosome biorientation. (A) Time-lapse analysis of Flp-in HeLa cells expressing LAP-KNL1 variants, transfected with siLUC or siKNL1, and treated with nocodazole and 250 nM reversine. Data (n = 40 representative of 3 independent experiments) indicate cumulative fraction of cells that exit from mitosis (as scored by cell morphology using DIC) at the indicated time after NEB. (B) As in A, but with transfection of the indicated siRNAs. (C) Immunostaining and quantification of centromeric H2A-Thr120 phosphorylation in Flp-in HeLa cells expressing LAP-KNL1 variants and transfected with siLUC or siKNL1. pH2A-Thr120 is shown in green, centromeres (CREST) in red, and DNA (DAPI) in blue. Bars, 5 µm. pH2A-Thr120 is quantified over CREST (n = 10 representative of 3 independent experiments). (D) Immunostaining and quantification of chromosome alignment in Flp-in HeLa cells expressing LAP-KNL1 variants, transfected with siLUC or siKNL1, and treated with MG132 for 45 min. Tubulin is shown in green, centromeres (CREST) in red, and DNA (DAPI) in blue. Bars, 5 µm. The data shown are from a single representative experiment out of three repeats. For the experiment shown, n = 50. (E) Time-lapse analysis of Flp-in HeLa cells expressing LAP-KNL1 variants and transfected with siLUC or siKNL1. Data (n = 40 representative of 3 independent experiments) indicate cumulative fraction of cells that exit from mitosis at the indicated time after NEB (as scored by GFP-H2B).
Figure 3.
KNL1 contains multiple independent BUB recruitment modules. (A) Schematic representation of KNL1 showing the microtubule- and PP1-binding domain in green and the kinetochore recruitment domain in orange. KI1 and KI2 motifs are shown as green bars, MELT-like sequences in red, and TΩ-like sequences in blue. Dashed lines indicate the generated LacI-LAP-KNL1 fragments used in B. (B) Immunolocalization of BUB1 (red) in nocodazole-treated U2OS-LacO cells transfected with LacI-LAP-KNL1 fragments. LacI-LAP-KNL1 fragments are shown in green, centromeres (CREST) in blue, and DNA (DAPI) in white. Insets show magnifications of the boxed regions. Bars, 5 µm (insets, 0.5 µm). Table indicates the ability (− or +) to recruit BUB1 and BUBR1 by the indicated KNL1 fragments (see also
Fig. S3, A and B
). (C) Alignment of identified TΩ-MELT modules showing conserved (green/purple/red/blue) and atypical (orange/yellow) amino acids. (D) Sequence logo of the 19 TΩ-MELT units. (E) As in B, but with LacI-LAP-KNL1818–1051 (M3) or mutant variants thereof. These variants are: M3-TAΩA (TxxΩ to AxxA), M3-MELTA (MELT to MELA), and A3 (TxxΩ-MELT to AxxA-AELA), as shown in
Fig. S3 C
.
Figure 4.
Engineered KNL1 proteins reveal differential requirements for TΩ-MELT modules in the SAC and chromosome biorientation. (A) Schematic representation of synthetic LAP-KNL1 constructs, showing the microtubule- and PP1-binding domain in green and the kinetochore recruitment domain in orange. KI1 and KI2 motifs are shown as green bars, MELT-like sequences in blue, and TxxΩ-like sequences in red. See main text for details about constructs. (B and C) Representative images (B) and quantification (C) of LAP-KNL1-expressing Flp-in HeLa cells transfected with siRNAs to luciferase (siLUC) or to KNL1 (siKNL1) and treated with nocodazole. LAP-KNL1 is shown in green, BUB1 in red, centromeres (CREST) in blue, and DNA (DAPI) in white. Bars, 5 µm. Quantification in C shows total kinetochore signal intensity (+SD) of LAP-KNL1 and BUB proteins over CREST. Data are from >15 cells and representative of 3 experiments. Levels of kinetochore BUBs in control cells and of kinetochore LAP-KNL1 in KNL1-FL–expressing cells are set to 1. (D) Schematic as in A. See main text for details about constructs. (E) Time-lapse analysis of Flp-in HeLa cells expressing LAP-KNL1 variants, transfected with siLUC or siKNL1, and treated with nocodazole and 250 nM reversine. Data (n = 40 representative of 3 independent experiments) indicate cumulative fraction of cells that exit from mitosis (as scored by cell morphology using DIC) at the indicated time after NEB. (F) As in E, with the indicated constructs. (G) Time-lapse analysis of Flp-in HeLa cells expressing LAP-KNL1 variants and transfected with siLUC or siKNL1. Data (n = 40 representative of 3 independent experiments) indicate cumulative fraction of cells that exit from mitosis at the indicated time after NEB (as scored by GFP-H2B). (H) Quantification of chromosome alignment in Flp-in HeLa cells expressing LAP-KNL1 variants, transfected with siLUC or siKNL1, and treated with MG132 for 45 min. The data shown are from a single representative experiment out of three repeats. For the experiment shown, n = 40.
Figure 5.
TΩ-MELT modules in KNL1 are redundant and exchangeable. (A) Schematic representation of synthetic LAP-KNL1 constructs. For color codes, see Fig. 4 A. See main text for details about constructs. (B and C) Representative images (B) and quantification (C) of LAP-KNL1–expressing Flp-in HeLa cells transfected with siRNAs to luciferase (siLUC) or to KNL1 (siKNL1) and treated with nocodazole. LAP-KNL1 is shown in green, BUB1 in red, centromeres (CREST) in blue, and DNA (DAPI) in white. Bars, 5 µm. Quantification in C shows total kinetochore signal intensity (+SD) of LAP-KNL1 and BUB proteins over CREST. Data are from >15 cells and representative of 3 experiments. Levels of kinetochore BUBs in control cells and of kinetochore LAP-KNL1 in KNL1-FL–expressing cells are set to 1. (D) Quantification of chromosome alignment in Flp-in HeLa cells expressing LAP-KNL1 variants, transfected with siLUC or siKNL1, and treated with MG132 for 45 min. The data shown are from a single representative experiment out of three repeats. For the experiment shown, n = 40. (E) Time-lapse analysis of Flp-in HeLa cells expressing LAP-KNL1 variants, transfected with siLUC or siKNL1, and treated with nocodazole and 250 nM reversine. Data (n = 40 representative of 3 independent experiments) indicate cumulative fraction of cells that exit from mitosis (as scored by cell morphology using DIC) at the indicated time after NEB.
Figure 6.
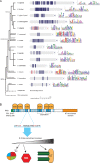
TΩ-MELT module evolution and model. (A) Schematic representation of eukaryotic tree of life showing KNL1 homologues from indicated species. Repeating units are shown in blue and red with the number of repeats in corresponding colors. Repeat sequences are shown as sequence logos. (B) Model for TΩ-MELT function in human KNL1. Conserved (dark blue) and degenerated (light blue) TΩ-MELT modules (essential amino acids in red) in KNL1 can independently recruit BUB protein complexes (BUBs) to promote H2A-Thr120 phosphorylation and SAC activity (few modules, low BUB levels) and chromosome biorientation (increasing fidelity with increasing modules and BUB levels).
Comment in
- Kinetochore signalling: the KIss that MELTs Knl1.
Bollen M. Bollen M. Curr Biol. 2014 Jan 20;24(2):R68-R70. doi: 10.1016/j.cub.2013.11.053. Curr Biol. 2014. PMID: 24456977
Similar articles
- KI motifs of human Knl1 enhance assembly of comprehensive spindle checkpoint complexes around MELT repeats.
Krenn V, Overlack K, Primorac I, van Gerwen S, Musacchio A. Krenn V, et al. Curr Biol. 2014 Jan 6;24(1):29-39. doi: 10.1016/j.cub.2013.11.046. Epub 2013 Dec 19. Curr Biol. 2014. PMID: 24361068 - A minimal number of MELT repeats supports all the functions of KNL1 in chromosome segregation.
Zhang G, Lischetti T, Nilsson J. Zhang G, et al. J Cell Sci. 2014 Feb 15;127(Pt 4):871-84. doi: 10.1242/jcs.139725. Epub 2013 Dec 20. J Cell Sci. 2014. PMID: 24363448 - Sequential multisite phospho-regulation of KNL1-BUB3 interfaces at mitotic kinetochores.
Vleugel M, Omerzu M, Groenewold V, Hadders MA, Lens SMA, Kops GJPL. Vleugel M, et al. Mol Cell. 2015 Mar 5;57(5):824-835. doi: 10.1016/j.molcel.2014.12.036. Epub 2015 Feb 5. Mol Cell. 2015. PMID: 25661489 - The dynamic protein Knl1 - a kinetochore rendezvous.
Ghongane P, Kapanidou M, Asghar A, Elowe S, Bolanos-Garcia VM. Ghongane P, et al. J Cell Sci. 2014 Aug 15;127(Pt 16):3415-23. doi: 10.1242/jcs.149922. Epub 2014 Jul 22. J Cell Sci. 2014. PMID: 25052095 Review.
Cited by
- Signaling protein abundance modulates the strength of the spindle assembly checkpoint.
Jema S, Chen C, Humphrey L, Karmarkar S, Ferrari F, Joglekar AP. Jema S, et al. Curr Biol. 2023 Oct 23;33(20):4505-4515.e4. doi: 10.1016/j.cub.2023.08.074. Epub 2023 Sep 21. Curr Biol. 2023. PMID: 37738972 Free PMC article. - Mechanistic insight into TRIP13-catalyzed Mad2 structural transition and spindle checkpoint silencing.
Brulotte ML, Jeong BC, Li F, Li B, Yu EB, Wu Q, Brautigam CA, Yu H, Luo X. Brulotte ML, et al. Nat Commun. 2017 Dec 5;8(1):1956. doi: 10.1038/s41467-017-02012-2. Nat Commun. 2017. PMID: 29208896 Free PMC article. - Natural Loss of Mps1 Kinase in Nematodes Uncovers a Role for Polo-like Kinase 1 in Spindle Checkpoint Initiation.
Espeut J, Lara-Gonzalez P, Sassine M, Shiau AK, Desai A, Abrieu A. Espeut J, et al. Cell Rep. 2015 Jul 7;12(1):58-65. doi: 10.1016/j.celrep.2015.05.039. Epub 2015 Jun 25. Cell Rep. 2015. PMID: 26119738 Free PMC article. - Regulation of mitotic progression by the spindle assembly checkpoint.
Lischetti T, Nilsson J. Lischetti T, et al. Mol Cell Oncol. 2015 Jan 30;2(1):e970484. doi: 10.4161/23723548.2014.970484. eCollection 2015 Jan-Mar. Mol Cell Oncol. 2015. PMID: 27308407 Free PMC article. Review. - A motif from Lys216 to Lys222 in human BUB3 protein is a nuclear localization signal and critical for BUB3 function in mitotic checkpoint.
Zhu S, Jing R, Yang Y, Huang Y, Wang X, Leng Y, Xi J, Wang G, Jia W, Kang J. Zhu S, et al. J Biol Chem. 2015 May 1;290(18):11282-92. doi: 10.1074/jbc.M114.598029. Epub 2015 Mar 26. J Biol Chem. 2015. PMID: 25814666 Free PMC article.
References
- Bolanos-Garcia V.M., Lischetti T., Matak-Vinković D., Cota E., Simpson P.J., Chirgadze D.Y., Spring D.R., Robinson C.V., Nilsson J., Blundell T.L. 2011. Structure of a Blinkin-BUBR1 complex reveals an interaction crucial for kinetochore-mitotic checkpoint regulation via an unanticipated binding Site. Structure. 19:1691–1700 10.1016/j.str.2011.09.017 - DOI - PMC - PubMed
Publication types
MeSH terms
Substances
LinkOut - more resources
Full Text Sources
Other Literature Sources
Research Materials


