Comparative ribosome profiling reveals extensive translational complexity in different Trypanosoma brucei life cycle stages - PubMed (original) (raw)
Comparative ribosome profiling reveals extensive translational complexity in different Trypanosoma brucei life cycle stages
Juan-José Vasquez et al. Nucleic Acids Res. 2014 Apr.
Abstract
While gene expression is a fundamental and tightly controlled cellular process that is regulated at multiple steps, the exact contribution of each step remains unknown in any organism. The absence of transcription initiation regulation for RNA polymerase II in the protozoan parasite Trypanosoma brucei greatly simplifies the task of elucidating the contribution of translation to global gene expression. Therefore, we have sequenced ribosome-protected mRNA fragments in T. brucei, permitting the genome-wide analysis of RNA translation and translational efficiency. We find that the latter varies greatly between life cycle stages of the parasite and ∼100-fold between genes, thus contributing to gene expression to a similar extent as RNA stability. The ability to map ribosome positions at sub-codon resolution revealed extensive translation from upstream open reading frames located within 5' UTRs and enabled the identification of hundreds of previously un-annotated putative coding sequences (CDSs). Evaluation of existing proteomics and genome-wide RNAi data confirmed the translation of previously un-annotated CDSs and suggested an important role for >200 of those CDSs in parasite survival, especially in the form that is infective to mammals. Overall our data show that translational control plays a prevalent and important role in different parasite life cycle stages of T. brucei.
Figures
Figure 1.
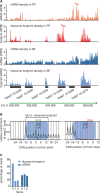
Ribosome footprints reveal coding sequences at sub-codon resolution. (A) Ribosome footprints are strongly enriched across CDSs. mRNA densities and ribosome densities are shown as reads per nucleotide per million reads (RPM) to normalize for differences in library size. (B) Alignment of the 5′ nucleotide from ribosome footprint reads that map close to translation start or translation termination sites. Blue boxes mark the approximate size of the ribosome footprint. (C) Percentage of position of sequence reads relative to reading frame.
Figure 2.
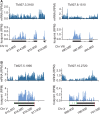
Ribosome footprints reveal translated regions. (A) Ribosome profiles for the two intron-containing genes. Introns are represented as a dashed line. (B) Ribosome profiles of two possibly mis-annotated CDSs. Black bars mark annotated CDSs. Grey bars mark CDSs predicted based on ribosome profiles. Green boxes represent ATG codons and red boxes represent stop codons.
Figure 3.
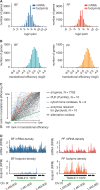
Translational efficiency is regulated. (A) Histograms of mRNA abundance and ribosome density (rate of protein synthesis) for BF (left panel) and PF parasites (right panel). (B) Histogram of translational efficiency (ratio of ribosome footprint density to mRNA abundance) for BF (left panel) and PF parasites (right panel). (C) Pair-wise comparisons of translational efficiency in PF and BF. CDSs were ranked based on translational efficiency (1 = highest translational efficiency, 7782 = lowest translational efficiency) in BF and PF. Ranks between life cycle stages show a correlation of R = 0.7428. Gene families with developmentally regulated translational efficiencies are colour coded: Pumillio genes (red), cytochromes oxidase (blue) genes required for glycolysis (63) (green) and the alternative oxidase (Tb927.10.7090, black). (D) Ribosome footprint profile of a gene with developmentally regulated translational efficiency. Green arrow indicates direction of transcription.
Figure 4.
Ribosome footprints reveal translation of uORFs. (A) Alignment of the 5′ nucleotides from ribosome footprint reads that map close to translation start or translation termination sites of uORFs. (B) Percentage of position of sequence reads relative to reading frame. (C) Ribosome profiles of two genes with uORF (left panel) and without uORF (right panel). Narrow grey boxes represent 5′ UTRs, green box represents AUG-codon, red box represents termination codon.
Figure 5.
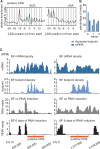
Ribosome footprints reveal previously un-annotated CDSs. (A) Alignment of the 5′ nucleotides from ribosome footprint reads that map close to translation start or translation termination sites of candidate CDSs. (B) Percentage of position of sequence reads relative to reading frame. (C) Ribosome, mRNA and RIT-seq (RNAi target sequencing) profiles of two previously un-annotated putative CDSs.
Similar articles
- Advancing Trypanosoma brucei genome annotation through ribosome profiling and spliced leader mapping.
Parsons M, Ramasamy G, Vasconcelos EJ, Jensen BC, Myler PJ. Parsons M, et al. Mol Biochem Parasitol. 2015 Aug;202(2):1-10. doi: 10.1016/j.molbiopara.2015.09.002. Epub 2015 Sep 21. Mol Biochem Parasitol. 2015. PMID: 26393539 Free PMC article. - Extensive stage-regulation of translation revealed by ribosome profiling of Trypanosoma brucei.
Jensen BC, Ramasamy G, Vasconcelos EJ, Ingolia NT, Myler PJ, Parsons M. Jensen BC, et al. BMC Genomics. 2014 Oct 20;15(1):911. doi: 10.1186/1471-2164-15-911. BMC Genomics. 2014. PMID: 25331479 Free PMC article. - Ribosome profiling reveals translation control as a key mechanism generating differential gene expression in Trypanosoma cruzi.
Smircich P, Eastman G, Bispo S, Duhagon MA, Guerra-Slompo EP, Garat B, Goldenberg S, Munroe DJ, Dallagiovanna B, Holetz F, Sotelo-Silveira JR. Smircich P, et al. BMC Genomics. 2015 Jun 9;16(1):443. doi: 10.1186/s12864-015-1563-8. BMC Genomics. 2015. PMID: 26054634 Free PMC article. - Illuminating Parasite Protein Production by Ribosome Profiling.
Parsons M, Myler PJ. Parsons M, et al. Trends Parasitol. 2016 Jun;32(6):446-457. doi: 10.1016/j.pt.2016.03.005. Epub 2016 Apr 6. Trends Parasitol. 2016. PMID: 27061497 Free PMC article. Review. - The cell biology of Trypanosoma brucei differentiation.
Fenn K, Matthews KR. Fenn K, et al. Curr Opin Microbiol. 2007 Dec;10(6):539-46. doi: 10.1016/j.mib.2007.09.014. Epub 2007 Nov 9. Curr Opin Microbiol. 2007. PMID: 17997129 Free PMC article. Review.
Cited by
- Trypanosoma brucei Acyl-Protein Thioesterase-like (TbAPT-L) Is a Lipase with Esterase Activity for Short and Medium-Chain Fatty Acids but Has No Depalmitoylation Activity.
Brown RWB, Sharma AI, Villanueva MR, Li X, Onguka O, Zilbermintz L, Nguyen H, Falk BA, Olson CL, Taylor JM, Epting CL, Kathayat RS, Amara N, Dickinson BC, Bogyo M, Engman DM. Brown RWB, et al. Pathogens. 2022 Oct 27;11(11):1245. doi: 10.3390/pathogens11111245. Pathogens. 2022. PMID: 36364996 Free PMC article. - Transcriptomic changes across the life cycle of Trypanosoma cruzi II.
Cruz-Saavedra L, Vallejo GA, Guhl F, Ramírez JD. Cruz-Saavedra L, et al. PeerJ. 2020 May 14;8:e8947. doi: 10.7717/peerj.8947. eCollection 2020. PeerJ. 2020. PMID: 32461822 Free PMC article. - Gene expression to mitochondrial metabolism: Variability among cultured Trypanosoma cruzi strains.
Kalem MC, Gerasimov ES, Vu PK, Zimmer SL. Kalem MC, et al. PLoS One. 2018 May 30;13(5):e0197983. doi: 10.1371/journal.pone.0197983. eCollection 2018. PLoS One. 2018. PMID: 29847594 Free PMC article. - Upstream ORFs Influence Translation Efficiency in the Parasite Trypanosoma cruzi.
Radío S, Garat B, Sotelo-Silveira J, Smircich P. Radío S, et al. Front Genet. 2020 Feb 28;11:166. doi: 10.3389/fgene.2020.00166. eCollection 2020. Front Genet. 2020. PMID: 32180802 Free PMC article. - Functional genomics in sand fly-derived Leishmania promastigotes.
Alcolea PJ, Alonso A, Molina R, Jiménez M, Myler PJ, Larraga V. Alcolea PJ, et al. PLoS Negl Trop Dis. 2019 May 9;13(5):e0007288. doi: 10.1371/journal.pntd.0007288. eCollection 2019 May. PLoS Negl Trop Dis. 2019. PMID: 31071080 Free PMC article. Review.
References
- Moore MJ. From birth to death: the complex lives of eukaryotic mRNAs. Science. 2005;309:1514–1518. - PubMed
- Lu P, Vogel C, Wang R, Yao X, Marcotte EM. Absolute protein expression profiling estimates the relative contributions of transcriptional and translational regulation. Nat. Biotechnol. 2007;25:117–124. - PubMed
- de Godoy LM, Olsen JV, Cox J, Nielsen ML, Hubner NC, Frohlich F, Walther TC, Mann M. Comprehensive mass-spectrometry-based proteome quantification of haploid versus diploid yeast. Nature. 2008;455:1251–1254. - PubMed
- McNicoll F, Drummelsmith J, Muller M, Madore E, Boilard N, Ouellette M, Papadopoulou B. A combined proteomic and transcriptomic approach to the study of stage differentiation in Leishmania infantum. Proteomics. 2006;6:3567–3581. - PubMed
Publication types
MeSH terms
Substances
LinkOut - more resources
Full Text Sources
Other Literature Sources
Molecular Biology Databases


