TRPM2 channels protect against cardiac ischemia-reperfusion injury: role of mitochondria - PubMed (original) (raw)
. 2014 Mar 14;289(11):7615-29.
doi: 10.1074/jbc.M113.533851. Epub 2014 Feb 3.
Nicholas E Hoffman, Salim Merali, Xue-Qian Zhang, JuFang Wang, Sudarsan Rajan, Santhanam Shanmughapriya, Erhe Gao, Carlos A Barrero, Karthik Mallilankaraman, Jianliang Song, Tongda Gu, Iwona Hirschler-Laszkiewicz, Walter J Koch, Arthur M Feldman, Muniswamy Madesh, Joseph Y Cheung
Affiliations
- PMID: 24492610
- PMCID: PMC3953274
- DOI: 10.1074/jbc.M113.533851
TRPM2 channels protect against cardiac ischemia-reperfusion injury: role of mitochondria
Barbara A Miller et al. J Biol Chem. 2014.
Abstract
Cardiac TRPM2 channels were activated by intracellular adenosine diphosphate-ribose and blocked by flufenamic acid. In adult cardiac myocytes the ratio of GCa to GNa of TRPM2 channels was 0.56 ± 0.02. To explore the cellular mechanisms by which TRPM2 channels protect against cardiac ischemia/reperfusion (I/R) injury, we analyzed proteomes from WT and TRPM2 KO hearts subjected to I/R. The canonical pathways that exhibited the largest difference between WT-I/R and KO-I/R hearts were mitochondrial dysfunction and the tricarboxylic acid cycle. Complexes I, III, and IV were down-regulated, whereas complexes II and V were up-regulated in KO-I/R compared with WT-I/R hearts. Western blots confirmed reduced expression of the Complex I subunit and other mitochondria-associated proteins in KO-I/R hearts. Bioenergetic analyses revealed that KO myocytes had a lower mitochondrial membrane potential, mitochondrial Ca(2+) uptake, ATP levels, and O2 consumption but higher mitochondrial superoxide levels. Additionally, mitochondrial Ca(2+) uniporter (MCU) currents were lower in KO myocytes, indicating reduced mitochondrial Ca(2+) uptake was likely due to both lower ψm and MCU activity. Similar to isolated myocytes, O2 consumption and ATP levels were also reduced in KO hearts. Under a simulated I/R model, aberrant mitochondrial bioenergetics was exacerbated in KO myocytes. Reactive oxygen species levels were also significantly higher in KO-I/R compared with WT-I/R heart slices, consistent with mitochondrial dysfunction in KO-I/R hearts. We conclude that TRPM2 channels protect the heart from I/R injury by ameliorating mitochondrial dysfunction and reducing reactive oxygen species levels.
Keywords: Calcium Channels; Cardiac Ischemia; Cardiovascular Disease; Electrophysiology; Global Proteomics Analysis; Mitochondria; Mitochondrial Bioenergetics; TRP Channels.
Figures
FIGURE 1.
ADPR activates cationic currents in WT but not TRPM2 KO myocytes. LV myocytes were isolated from WT and KO hearts. The standard patch clamp whole cell configuration was used. Composition of pipette and external solutions and voltage-ramp protocols are given under “Experimental Procedures”. I-V relationships of cationic current (means ± S.E.) from WT + ADPR (300 μ
m
) (●; n = 5), WT (○; n = 4), KO + ADPR (■; n = 7) and KO (□; n = 3) myocytes are shown. Error bars are not shown if they fell within the boundaries of the symbol. Two-way analysis of variance indicate p < 0.0001 for WT + ADPR versus WT or KO + ADPR or KO myocytes. pF, picofarads.
FIGURE 2.
WT TRPM2 currents do not inactivate and estimation of GCa and GNa. WT myocytes were held at −80 mV. ADPR was included in the pipette solution to activate TRPM2 channels. With 140 m
m
[Na+]o, after break-in, a large inward current that did not inactivate was observed. The current showed a linear increase with increasing hyperpolarization. After media change to a medium containing 110 m
m
[Ca2+]o, current became smaller and demonstrated a linear decrease with depolarization from −100 to −80 mV. GCa and GNa were estimated from the slope of I-V relationship (“Experimental Procedures”).
FIGURE 3.
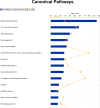
Top network functions generated using Ingenuity Pathways Analysis for KO-I/R versus WT-I/R hearts. Differentially expressed proteins between KO-I/R and WT-I/R hearts (n = 4 each) were determined using GeLC-MS/MS (“Experimental Procedures”). The graph represents cell functions with the highest score (y axis) based on the number of differentially regulated proteins. The orange squares and line in the graph show the ratio of the number of proteins altered identified from our dataset that are in the pathway relative to the total number of proteins in the pathway.
FIGURE 4.
Ingenuity Pathways Analysis of mitochondrial proteins that are differentially expressed between KO-I/R and WT-I/R hearts. Mitochondrial network was generated from the differentially expressed proteins according to the Ingenuity Pathway Knowledge Criteria. Pink, significantly up-regulated proteins; green, significantly down-regulated proteins; white, proteins known to be in the network but were not identified in our analysis.
FIGURE 5.
Expression of proteins associated with mitochondria. Homogenates of LV apices from WT-I/R and KO-I/R hearts were prepared and proteins subjected to Western blots (“Experimental Procedures”). Protein band intensities are quantified by densitometry, normalized to calsequestrin signals, and summarized in bar graphs at the right. *, p < 0.05.
FIGURE 6.
Mitochondrial membrane potential and mitochondrial Ca2+ uptake are lower in KO myocytes subjected to hypoxia/reoxygenation. LV myocytes isolated from WT and KO mice were subjected to normoxia or hypoxia for 2 h followed by 30 min of reoxygenation (“Experimental Procedures”). Myocytes were permeabilized with digitonin and supplemented with succinate. A, the ratiometric indicator JC-1 was added at 20s and used to monitor Δψm. Arrows indicate the addition of JC-1, Ca2+ (10 μ
m
), and the mitochondrial uncoupler CCCP (2 μ
m
). B, summary of Δψm after Ca2+ addition but before CCCP addition (n = 3 each). C, the ratiometric dye Fura-FF was added at 0 s and used to monitor extra-mitochondrial Ca2+. Repeated pulses of Ca2+ (10 μ
m
) were added as indicated (arrows). The cytosolic Ca2+ clearance rate after the first Ca2+ pulse was measured. f.a.u., fluorescence arbitrary units. D, summary of cytosolic Ca2+ clearance (mitochondrial Ca2+ uptake) rates (n = 3 each). *, p < 0.05; **, p < 0.01; ***, p < 0.001.
FIGURE 7.
Mitochondrial Ca2+ uniporter activity (_I_MCU) is lower in KO myocytes, but basal mitochondrial Ca2+ levels are similar between WT and KO myocytes. A, currents from cardiac mitoplasts (_I_MCU) were recorded before and after application of 5 m
m
Ca2+ to the bath medium. _I_MCU were recorded during a voltage-ramp as indicated. Traces are representative single recordings of _I_MCU from WT (black) and KO (blue) myocytes. B, current-time integral indicating the amount of Ca2+ influx during voltage-ramp (fmol/picofarads) in WT (black) and KO (blue) mitoplasts; n = 3 each. pF, picofarads. C, freshly isolated myocytes from WT and KO mice were permeabilized with digitonin and supplemented with succinate. The ratiometric dye Fura-FF was used to monitor extra-mitochondrial Ca2+. After steady-state Fura-FF signals were obtained, CGP37157 (10 μ
m
) was added to inhibit mitochondrial Ca2+ release via the mitochondrial Na+/Ca2+ exchanger. CCCP (2 μ
m
) was then added to release endogenous mitochondrial Ca2+. D, quantitation of mitochondrial Ca2+ contents (n = 4 each). **, p < 0.01.
FIGURE 8.
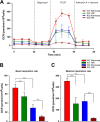
O2 consumption is markedly reduced in KO-H/R myocytes. LV myocytes isolated from WT and KO mice were subjected to normoxia or hypoxia for 2 h followed by 30 min of reoxygenation. O2 consumption rate was measured in intact myocytes (“Experimental Procedures”). A, after basal OCR was obtained, oligomycin (1 μ
m
) was added to inhibit F0F1ATPase (Complex V). The uncoupler carbonyl cyanide 4-(trifluoromethoxy)phenylhydrazone (FCCP; 1 μ
m
) was then added, and maximal OCR was measured. Finally, antimycin A + rotenone (1 μ
m
each) were added to inhibit cytochrome bc1 complex (Complex III) and NADH dehydrogenase (Complex I), respectively. Each point in the traces represents the average of eight different wells. B and C, summary of basal (B) and maximal (C) OCR of 4 groups of myocytes (n = 3 each). ***, p < 0.001.
FIGURE 9.
ATP levels and O2 consumption are lower in KO hearts. A, hearts from WT (black) and KO (blue) mice were homogenized, and ATP levels were measured by CellTiter-Glo assay. n = 3 each. B, similarly, freshly isolated myocytes from WT (black) and KO (blue) mice were used to measure the ATP levels. n = 6 each. C, heart slices generated from WT (black) and KO (blue) mice were subjected to OCR measurement, and the graph represents the basal OCR. n = 3 each. *, p < 0.05; ***, p < 0.001.
FIGURE 10.
In situ ROS levels are prominent in KO-I/R heart slices. Hearts from WT and KO mice were subjected to sham operation or 30 min ischemia followed by 30 min reperfusion, after which ROS levels were measured in heart slices (“Experimental Procedures”). A, multi-photon confocal images of DHE-stained LV slices. B, 2.5-dimensional heatmap plots of mean DHE intensity are shown for WT-sham, KO-sham, WT-I/R, and KO-I/R heart slices. C, quantitation of DHE fluorescence in fluorescence arbitrary units (f.a.u.). DHE fluorescence from at least 3 slices from each heart are quantitated for WT-sham (2 mice), KO-sham (2 mice), WT-I/R (2 mice), and KO-I/R (5 mice) animals. *, p < 0.05; **, p < 0.01.
FIGURE 11.
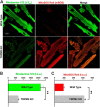
Mitochondrial membrane potential is lower and mitochondrial ROS level is higher in KO myocytes. A, myocytes isolated from WT and KO mice were loaded with the mitochondrial membrane potential indicator rhodamine 123 and mitochondrial superoxide indicator MitoSOX Red. Confocal images showed co-localization of MitoSOX Red and rhodamine 123 signals. B and C, quantitation of rhodamine 123 (ψm) and MitoSOX Red (mROS) signal intensities in fluorescence arbitrary units (f.a.u.) from WT (n = 21) and KO (n = 19) myocytes. **, p < 0.01.
FIGURE 12.
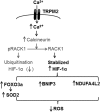
Hypothetical mechanism by which cardiac TRPM2 channels modulate mitochondrial function and ROS production. Ca2+ influx via activated TRPM2 channels increases cytosolic Ca2+ concentration, thereby activating calcineurin. Calcineurin dephosphorylates RACK1 and blocks RACK1 dimerization. The net result is increased HIF-1α levels by impeding its ubiquitination and degradation. HIF-1α enhances many target gene transcription including FoxO3a, which leads to increased SOD2 expression, and mitochondrial NDUFA4L2 (Complex I) and other mitochondrial gene (BNIP3) expression. Both SOD2 and physiological Complex I activity result in reduced mitochondrial ROS levels. Differences in protein levels between WT-I/R and KO-I/R hearts that have been authenticated by experimental results from the present (Fig. 5) or previous (5) studies are in bold fonts, whereas hypothetical signaling molecules are in regular fonts.
Similar articles
- Ca²⁺ entry via Trpm2 is essential for cardiac myocyte bioenergetics maintenance.
Hoffman NE, Miller BA, Wang J, Elrod JW, Rajan S, Gao E, Song J, Zhang XQ, Hirschler-Laszkiewicz I, Shanmughapriya S, Koch WJ, Feldman AM, Madesh M, Cheung JY. Hoffman NE, et al. Am J Physiol Heart Circ Physiol. 2015 Mar 15;308(6):H637-50. doi: 10.1152/ajpheart.00720.2014. Epub 2015 Jan 9. Am J Physiol Heart Circ Physiol. 2015. PMID: 25576627 Free PMC article. - The second member of transient receptor potential-melastatin channel family protects hearts from ischemia-reperfusion injury.
Miller BA, Wang J, Hirschler-Laszkiewicz I, Gao E, Song J, Zhang XQ, Koch WJ, Madesh M, Mallilankaraman K, Gu T, Chen SJ, Keefer K, Conrad K, Feldman AM, Cheung JY. Miller BA, et al. Am J Physiol Heart Circ Physiol. 2013 Apr 1;304(7):H1010-22. doi: 10.1152/ajpheart.00906.2012. Epub 2013 Feb 1. Am J Physiol Heart Circ Physiol. 2013. PMID: 23376831 Free PMC article. - Trpm2 enhances physiological bioenergetics and protects against pathological oxidative cardiac injury: Role of Pyk2 phosphorylation.
Miller BA, Wang J, Song J, Zhang XQ, Hirschler-Laszkiewicz I, Shanmughapriya S, Tomar D, Rajan S, Feldman AM, Madesh M, Sheu SS, Cheung JY. Miller BA, et al. J Cell Physiol. 2019 Sep;234(9):15048-15060. doi: 10.1002/jcp.28146. Epub 2019 Jan 13. J Cell Physiol. 2019. PMID: 30637731 Free PMC article. - TRPM2 protects against tissue damage following oxidative stress and ischaemia-reperfusion.
Miller BA, Cheung JY. Miller BA, et al. J Physiol. 2016 Aug 1;594(15):4181-91. doi: 10.1113/JP270934. Epub 2015 Nov 11. J Physiol. 2016. PMID: 26420388 Free PMC article. Review. - Transient Receptor Potential-Melastatin Channel Family Member 2: Friend or Foe.
Cheung JY, Miller BA. Cheung JY, et al. Trans Am Clin Climatol Assoc. 2017;128:308-329. Trans Am Clin Climatol Assoc. 2017. PMID: 28790515 Free PMC article. Review.
Cited by
- The human ion channel TRPM2 modulates neuroblastoma cell survival and mitochondrial function through Pyk2, CREB, and MCU activation.
Hirschler-Laszkiewicz I, Chen SJ, Bao L, Wang J, Zhang XQ, Shanmughapriya S, Keefer K, Madesh M, Cheung JY, Miller BA. Hirschler-Laszkiewicz I, et al. Am J Physiol Cell Physiol. 2018 Oct 1;315(4):C571-C586. doi: 10.1152/ajpcell.00098.2018. Epub 2018 Jul 18. Am J Physiol Cell Physiol. 2018. PMID: 30020827 Free PMC article. - Knocking down TRPM2 expression reduces cell injury and NLRP3 inflammasome activation in PC12 cells subjected to oxygen-glucose deprivation.
Pan T, Zhu QJ, Xu LX, Ding X, Li JQ, Sun B, Hua J, Feng X. Pan T, et al. Neural Regen Res. 2020 Nov;15(11):2154-2161. doi: 10.4103/1673-5374.282271. Neural Regen Res. 2020. PMID: 32394974 Free PMC article. - Trpm2 Ablation Accelerates Protein Aggregation by Impaired ADPR and Autophagic Clearance in the Brain.
Jang Y, Lee B, Kim H, Jung S, Lee SH, Lee SY, Jeon JH, Kim IB, Lee SH, Kim BJ, Kim UH, Lee Y, Kim SM, Jeon D, Oh U. Jang Y, et al. Mol Neurobiol. 2019 May;56(5):3819-3832. doi: 10.1007/s12035-018-1309-0. Epub 2018 Sep 13. Mol Neurobiol. 2019. PMID: 30215158 Free PMC article. - Transient receptor potential channels in cardiac health and disease.
Hof T, Chaigne S, Récalde A, Sallé L, Brette F, Guinamard R. Hof T, et al. Nat Rev Cardiol. 2019 Jun;16(6):344-360. doi: 10.1038/s41569-018-0145-2. Nat Rev Cardiol. 2019. PMID: 30664669 Review. - Dihydromyricetin Ameliorates Cardiac Ischemia/Reperfusion Injury through Sirt3 Activation.
Wei L, Sun X, Qi X, Zhang Y, Li Y, Xu Y. Wei L, et al. Biomed Res Int. 2019 Apr 16;2019:6803943. doi: 10.1155/2019/6803943. eCollection 2019. Biomed Res Int. 2019. PMID: 31139646 Free PMC article.
References
- Ramsey I. S., Delling M., Clapham D. E. (2006) An introduction to TRP channels. Annu. Rev. Physiol. 68, 619–647 - PubMed
- Nilius B., Owsianik G., Voets T., Peters J. A. (2007) Transient receptor potential cation channels in disease. Physiol. Rev. 87, 165–217 - PubMed
- Miller B. A., Wang J., Hirschler-Laszkiewicz I., Gao E., Song J., Zhang X. Q., Koch W. J., Madesh M., Mallilankaraman K., Gu T., Chen S. J., Keefer K., Conrad K., Feldman A. M., Cheung J. Y. (2013) The second member of transient receptor potential-melastatin channel family protects hearts from ischemia-reperfusion injury. Am. J. Physiol. Heart Circ. Physiol. 304, H1010–H1022 - PMC - PubMed
Publication types
MeSH terms
Substances
Grants and funding
- R01-DK46778/DK/NIDDK NIH HHS/United States
- R01-HL85503/HL/NHLBI NIH HHS/United States
- R01-HL56205/HL/NHLBI NIH HHS/United States
- R01-HL61690/HL/NHLBI NIH HHS/United States
- P01-HL-91799/HL/NHLBI NIH HHS/United States
- R21-CA165068/CA/NCI NIH HHS/United States
- R01 DK046778/DK/NIDDK NIH HHS/United States
- P01 HL075443/HL/NHLBI NIH HHS/United States
- R01 HL056205/HL/NHLBI NIH HHS/United States
- P01 HL091799/HL/NHLBI NIH HHS/United States
- R01-HL74854/HL/NHLBI NIH HHS/United States
- R01 HL061690/HL/NHLBI NIH HHS/United States
- R21 CA165068/CA/NCI NIH HHS/United States
- R01 HL074854/HL/NHLBI NIH HHS/United States
- R01-HL58672/HL/NHLBI NIH HHS/United States
- P01-HL-75443/HL/NHLBI NIH HHS/United States
- R01-HL86699/HL/NHLBI NIH HHS/United States
- R01 HL085503/HL/NHLBI NIH HHS/United States
- R01 HL086699/HL/NHLBI NIH HHS/United States
- R01 HL058672/HL/NHLBI NIH HHS/United States
- P01-HL91799/HL/NHLBI NIH HHS/United States
LinkOut - more resources
Full Text Sources
Other Literature Sources
Molecular Biology Databases
Research Materials
Miscellaneous


