Gut microbiome composition and function in experimental colitis during active disease and treatment-induced remission - PubMed (original) (raw)
doi: 10.1038/ismej.2014.3. Epub 2014 Feb 6.
Patrick Veiga 2, Leslie H Wardwell-Scott 3, Timothy Tickle 1, Nicola Segata 1, Monia Michaud 1, Carey Ann Gallini 1, Chloé Beal 4, Johan E T van Hylckama-Vlieg 4, Sonia A Ballal 5, Xochitl C Morgan 1, Jonathan N Glickman 6, Dirk Gevers 7, Curtis Huttenhower 8, Wendy S Garrett 9
Affiliations
- PMID: 24500617
- PMCID: PMC4069400
- DOI: 10.1038/ismej.2014.3
Gut microbiome composition and function in experimental colitis during active disease and treatment-induced remission
Michelle G Rooks et al. ISME J. 2014 Jul.
Abstract
Dysregulated immune responses to gut microbes are central to inflammatory bowel disease (IBD), and gut microbial activity can fuel chronic inflammation. Examining how IBD-directed therapies influence gut microbiomes may identify microbial community features integral to mitigating disease and maintaining health. However, IBD patients often receive multiple treatments during disease flares, confounding such analyses. Preclinical models of IBD with well-defined disease courses and opportunities for controlled treatment exposures provide a valuable solution. Here, we surveyed the gut microbiome of the T-bet(-/-) Rag2(-/-) mouse model of colitis during active disease and treatment-induced remission. Microbial features modified among these conditions included altered potential for carbohydrate and energy metabolism and bacterial pathogenesis, specifically cell motility and signal transduction pathways. We also observed an increased capacity for xenobiotics metabolism, including benzoate degradation, a pathway linking host adrenergic stress with enhanced bacterial virulence, and found decreased levels of fecal dopamine in active colitis. When transferred to gnotobiotic mice, gut microbiomes from mice with active disease versus treatment-induced remission elicited varying degrees of colitis. Thus, our study provides insight into specific microbial clades and pathways associated with health, active disease and treatment interventions in a mouse model of colitis.
Figures
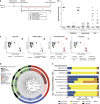
Figure 1
Experimental design and influence of interventions on the gut microbiome. (a) Study experimental schema. (b) Histologic colitis scores. Symbols represent individual mice. Error bars indicate mean±SEM. Colitis scores >2 indicate active colitis and scores ⩽2 remission. Sham, untreated, handling control; Gent, gentamicin; Metro, metronidazole; Vanco, vancomycin; Immunomods, anti-TNF-α or TRegs; MC, non-fermented milk control; FMP, fermented milk product; Diet, dietary intervention with FMP or MC in addition to ad libitum chow. (c) PCoA using unweighted UniFrac distances of gut microbial communities obtained from stool samples collected at baseline (pre-intervention) and upon treatment completion (post-intervention). The first two principal coordinates (PC) from the PCoA are plotted. Symbols represent data from individual mice, color-coded by the indicated metadata. (d) Gut microbiomes were clustered by similarity using the UPGMA clustering algorithm on the unweighted UniFrac distances. Samples from individual mice were clustered by the indicated intervention class (outside ring) or by the specific treatment (inside ring). (e) Phylum-level phylogenetic classification of 16S rRNA gene sequences. Bars represent mean relative abundances for each pre- or post-intervention group.
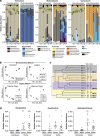
Figure 2
Antibiotic-driven microbial community shifts may be influenced by early-life exposures and are associated with specific clade responses. (a) Family-level phylogenetic classification of 16S rRNA gene sequences from stool samples collected pre- and post-intervention. Bars represent relative abundances of samples from individual mice. Labels indicate families with average relative abundances ⩾1% in at least one pre- or post-intervention group. Remaining families and reads assigned to higher level taxonomies were binned together in their associated phylum as ‘other' or ‘unclassified' (uncl.), respectively. (b) PCoA plots of the unweighted UniFrac distances of post-intervention stool samples from metronidazole- (_n_=10) and vancomycin (_n_=10)-treated mice. The first two PCs from the PCoA are plotted. Symbols represent data from individual mice, color-coded by the indicated metadata. For caging, M, metronidazole-treated; V, vancomycin-treated. (c) UPGMA clustering algorithm on the unweighted UniFrac distances of samples, color-coded by breeding pair. The letter and number assigned to the sire and dam, respectively, correspond to the PCoA plots in b. (d) Differentially abundant microbial clades in stool from mice with active colitis versus remission. Symbols represent data from individual mice from three independent experiments. Error bars indicate±SEM. Kruskal–Wallis test with Dunn's multiple comparison test: * or +P<0.05; ** or ++P<0.01; and *** or +++P<0.001.
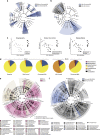
Figure 3
Immunomodulatories influence low abundance gut microbial community members and drive distinct microbial responses. (a) Left panel: Venn diagram of exclusive and shared species-level phylotypes (non-singleton OTUs, at ⩾97% sequence identity) in anti-TNF-α injected (_n_=10), TReg infused (_n_=10) or sham (untreated; _n_=12) mice. In total, 4420 OTUs were present across samples. Right panel: number of 16S rRNA gene sequences in each of the indicated segments of the Venn diagram. In total, 265 344 sequences were present across samples. (b) Differentially abundant microbial clades in stool from immunomodulatory-treated (anti-TNF-α or TRegs; _n_=20) versus sham (_n_=12) mice. (c) Differentially abundant microbial clades in stool from anti-TNF-α-(_n_=10) versus TReg (_n_=10)-treated mice. For cladograms, white circles represent non-significant microbial clades.
Figure 4
A FMP influences the microbial communities of the gut and MLNs. (a) Differentially abundant microbial clades in stool collected before and after FMP (_n_=10). (b) Differentially abundant microbial clades in stool after FMP (_n_=10) versus MC (_n_=10). (c) PCoA plots of the unweighted UniFrac distances of post-intervention stool samples (FMP, _n_=10; MC, _n_=10) and MLNs (FMP, _n_=21; MC, _n_=16; 5 MLNs/mouse). The first two PCs from the PCoA are plotted. Symbols represent data from individual mice, color-coded by the indicated metadata. (d) Phylum-level phylogenetic classification of 16S rRNA gene sequences from pre-intervention (_n_=20) and post-intervention stool samples (FMP, _n_=10; MC, _n_=10) and post-intervention MLNs (FMP, _n_=21; MC, _n_=16; 5 MLNs/mouse). Pie charts represent the mean relative abundances of phyla across mice from each group. (e) Differentially abundant microbial clades in post-intervention samples from stool (FMP, _n_=10; MC, _n_=10) versus MLNs (FMP, _n_=21; MC, _n_=16; 5 MLNs/mouse). (f) Differentially abundant microbial clades in post-intervention MLNs of FMP- (_n_=21) versus MC (_n_=16)-fed mice. *, aerotolerant genera;+, genera shared between MLNs and deep colonic crypt communities (Pédron et al., 2012). For cladograms, white circles represent non-significant microbial clades.
Figure 5
Gut microbiome composition in active colitis and treatment-induced remission with in vivo functional validation of pro-inflammatory activity in gnotobiotic TRUC mice. (a) Differentially abundant microbial clades in stool from mice with active colitis (_n_=31) versus remission (_n_=51) upon intervention completion. For cladogram, white circles represent non-significant microbial clades. (b) Experimental schema of 8-week gnotobiotic TRUC association with conventionally raised, SPF TRUC donor stool. SPF donors were treated for 4 weeks prior to stool collection. Stool from the indicated number of donors was pooled and transplanted into gnotobiotic TRUC recipients. (c) Histologic colitis scores of donors and recipients. Symbols represent data from individual mice. Error bars indicate±SEM. Mann–Whitney test: *P<0.05. (d) B. lactis and L. lactis levels quantified by RT-qPCR in stool from fermented milk (FMP)-treated donors (pooled; _n_=4) and their corresponding GF recipients (_n_=5).
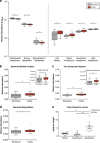
Figure 6
Inferred gut microbiome functions associated with active colitis and treatment-induced remission. Relative abundances of KO gene families grouped into BRITE functional hierarchies, as inferred by PICRUSt from 16S rRNA gene sequences. Differentially abundant microbial functions associated with active colitis (_n_=31) versus remission (_n_=51) upon intervention completion organized by KEGG BRITE categories (a) and pathways (b–d). Boxplots denote top quartile, median and bottom quartile. Whiskers and outliers are plotted by the Tukey method. (e) ELISA-based determinations of fecal dopamine levels. Symbols represent data from individual mice from three independent experiments. Mann–Whitney test: *P<0.05; **P<0.01 and ***P<0.001.
Similar articles
- Dietary iron variably modulates assembly of the intestinal microbiota in colitis-resistant and colitis-susceptible mice.
Ellermann M, Gharaibeh RZ, Maharshak N, Peréz-Chanona E, Jobin C, Carroll IM, Arthur JC, Plevy SE, Fodor AA, Brouwer CR, Sartor RB. Ellermann M, et al. Gut Microbes. 2020;11(1):32-50. doi: 10.1080/19490976.2019.1599794. Epub 2019 Jun 10. Gut Microbes. 2020. PMID: 31179826 Free PMC article. - Fecal Microbiota and Metabolome in a Mouse Model of Spontaneous Chronic Colitis: Relevance to Human Inflammatory Bowel Disease.
Robinson AM, Gondalia SV, Karpe AV, Eri R, Beale DJ, Morrison PD, Palombo EA, Nurgali K. Robinson AM, et al. Inflamm Bowel Dis. 2016 Dec;22(12):2767-2787. doi: 10.1097/MIB.0000000000000970. Inflamm Bowel Dis. 2016. PMID: 27824648 - Spontaneous episodic inflammation in the intestines of mice lacking HNF4A is driven by microbiota and associated with early life microbiota alterations.
Kelly C, Jawahar J, Davey L, Everitt JI, Galanko JA, Anderson C, Avendano JE, McCann JR, Sartor RB, Valdivia RH, Rawls JF. Kelly C, et al. mBio. 2023 Aug 31;14(4):e0150423. doi: 10.1128/mbio.01504-23. Epub 2023 Aug 1. mBio. 2023. PMID: 37526424 Free PMC article. - The microbiota and inflammatory bowel disease: insights from animal models.
Peloquin JM, Nguyen DD. Peloquin JM, et al. Anaerobe. 2013 Dec;24:102-6. doi: 10.1016/j.anaerobe.2013.04.006. Epub 2013 Apr 17. Anaerobe. 2013. PMID: 23603043 Free PMC article. Review. - Probiotics and antibiotics in IBD.
Sokol H. Sokol H. Dig Dis. 2014;32 Suppl 1:10-7. doi: 10.1159/000367820. Epub 2014 Dec 17. Dig Dis. 2014. PMID: 25531348 Review.
Cited by
- Prediction of Clinical Remission with Adalimumab Therapy in Patients with Ulcerative Colitis by Fourier Transform-Infrared Spectroscopy Coupled with Machine Learning Algorithms.
Kim SY, Shin SY, Saeed M, Ryu JE, Kim JS, Ahn J, Jung Y, Moon JM, Choi CH, Choi HK. Kim SY, et al. Metabolites. 2023 Dec 19;14(1):2. doi: 10.3390/metabo14010002. Metabolites. 2023. PMID: 38276292 Free PMC article. - Lactobacillus paracasei KBL382 administration attenuates atopic dermatitis by modulating immune response and gut microbiota.
Kim WK, Jang YJ, Han DH, Jeon K, Lee C, Han HS, Ko G. Kim WK, et al. Gut Microbes. 2020 Nov 9;12(1):1-14. doi: 10.1080/19490976.2020.1819156. Gut Microbes. 2020. PMID: 33016202 Free PMC article. - Alterations of the Gut Microbiome Associated With the Treatment of Hyperuricaemia in Male Rats.
Yu Y, Liu Q, Li H, Wen C, He Z. Yu Y, et al. Front Microbiol. 2018 Sep 19;9:2233. doi: 10.3389/fmicb.2018.02233. eCollection 2018. Front Microbiol. 2018. PMID: 30283432 Free PMC article. - Fecal and Mucosal Microbiota Profiling in Irritable Bowel Syndrome and Inflammatory Bowel Disease.
Lo Presti A, Zorzi F, Del Chierico F, Altomare A, Cocca S, Avola A, De Biasio F, Russo A, Cella E, Reddel S, Calabrese E, Biancone L, Monteleone G, Cicala M, Angeletti S, Ciccozzi M, Putignani L, Guarino MPL. Lo Presti A, et al. Front Microbiol. 2019 Jul 17;10:1655. doi: 10.3389/fmicb.2019.01655. eCollection 2019. Front Microbiol. 2019. PMID: 31379797 Free PMC article. - Interplay between inflammatory bowel disease therapeutics and the gut microbiome reveals opportunities for novel treatment approaches.
O'Reilly C, Mills S, Rea MC, Lavelle A, Ghosh S, Hill C, Ross RP. O'Reilly C, et al. Microbiome Res Rep. 2023 Sep 26;2(4):35. doi: 10.20517/mrr.2023.41. Microbiome Res Rep. 2023. PMID: 37849974 Free PMC article.
References
- Asano Y, Hiramoto T, Nishino R, Aiba Y, Kimura T, Yoshihara K, et al. Critical role of gut microbiota in the production of biologically active, free catecholamines in the gut lumen of mice. Am J Physiol Gastrointest Liver Physiol. 2012;303:G1288–G1295. - PubMed
- Benjamini Y, Hochberg Y. Controlling the false discovery rate: a practical and powerful approach to multiple testing. J R Stat Soc B. 1995;57:289–300.
Publication types
MeSH terms
Substances
Grants and funding
- R01CA154426/CA/NCI NIH HHS/United States
- P30 DK043351/DK/NIDDK NIH HHS/United States
- K08AI078942/AI/NIAID NIH HHS/United States
- T32 AI007638/AI/NIAID NIH HHS/United States
- R01 CA154426/CA/NCI NIH HHS/United States
- R01 HG005969/HG/NHGRI NIH HHS/United States
- 5T32AI007638/AI/NIAID NIH HHS/United States
- R01HG005969/HG/NHGRI NIH HHS/United States
- R01 GM099537/GM/NIGMS NIH HHS/United States
- K08 AI078942/AI/NIAID NIH HHS/United States
- P30 DK034854/DK/NIDDK NIH HHS/United States
LinkOut - more resources
Full Text Sources
Other Literature Sources


