Transcriptome profiling of the cold response and signaling pathways in Lilium lancifolium - PubMed (original) (raw)
Transcriptome profiling of the cold response and signaling pathways in Lilium lancifolium
Jingmao Wang et al. BMC Genomics. 2014.
Abstract
Background: Lilium lancifolium, a very important cold-resistant wild flower for lily cold resistance breeding, is widely distributed in southwestern and northeastern China. To gain a better understanding of the cold signaling pathway and the molecular metabolic reactions involved in the cold response, we performed a genome-wide transcriptional analysis using RNA-Seq.
Results: Approximately 104,703 million clean 90- bp paired-end reads were obtained from three libraries (CK 0 h, Cold-treated 2 h and 16 h at 4 °C); 18,736 unigenes showed similarity to known proteins in the Swiss-Prot protein database, and 15,898, 13,705 and 1849 unigenes aligned to existing sequences in the KEGG and COG databases (comprising 25 COG categories) and formed 12 SOM clusters, respectively. Based on qRT-PCR results, we studied three signal regulation pathways--the Ca(2+) and ABA independent/dependent pathways--that conduct cold signals to signal transduction genes such as LlICE and LlCDPK and transcription factor genes such as LlDREB1/CBF, LlAP2/EREBP, LlNAC1, LlR2R3-MYB and LlBZIP, which were expressed highly in bulb. LlFAD3, Llβ-amylase, LlP5CS and LlCLS responded to cold and enhanced adaptation processes that involve changes in the expression of transcripts related to cellular osmoprotectants and carbohydrate metabolism during cold stress.
Conclusions: Our study of differentially expressed genes involved in cold-related metabolic pathways and transcription factors facilitated the discovery of cold-resistance genes and the cold signal transcriptional networks, and identified potential key components in the regulation of the cold response in L lancifolium, which will be most beneficial for further research and in-depth exploration of cold-resistance breeding candidate genes in lily.
Figures
Figure 1
Clusters of orthologous groups (COG) classifications in Lilium lancifolium . These 13705 sequences have a COG classification within the 25 categories.
Figure 2
Histogram presentation of Gene Ontology classifications. The results are summarized in three main categories: biological process, cellular component, and molecular function. The y-axis on the right side indicates the percent of genes in a category, and the y-axis on the left side means the number of genes.
Figure 3
The expression of the gene changes among the different cold stress stages. A. The heat-map of the total differentially expressed genes (DEGs). Columns and rows in the heat maps represent samples and genes, respectively. Sample names are displayed below the heat maps. CK Results of controls, CT2h and 16h results of cold treatments. Color scale indicates fold changes of gene expression. A fold change of ≥1 is shown in green (increased transcript abundance), a fold change of ≤ -1 is shown in red (decreased transcript abundance), and no change is indicated in black. The results show that 1,028 transcripts were differentially expressed between the control and cold treatments 2 h and 16 h. B. Changes in gene expression profile among the different cold stress stages. The number of up-regulated and down-regulated genes between C0h-VS-T2h, C0h-VS-T16h and T2h-VS-T16h are summarized. Between the C0h and T2h Lilium lancifolium libraries, there are 115 genes up-regulated and 228 genes down-regulated, while there are 326 up-regulated genes and 828 down-regulated genes between the C0h and T16h Lilium lancifolium libraries, and 410 up-regulated genes 848 down-regulated genes between the C2h and T16h Lilium lancifolium libraries.
Figure 4
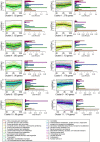
SOM cluster analysis of gene expression in the 12 different patterns. Clusters were obtained by the k-means method on the gene expression profiles of the 1849 modulated genes. The most abundant group is Cluster 8 and 1, with 323 and 276 genes whose expressions show positive slopes during stage of T2h to T16h embryogenesis. The second abundant group is Cluster 4, which contained 295 genes whose expression shows a negative slope from C0h to T2h.
Figure 5
Heat-map of 65 differentially expressed genes involved in transcription factor, signal transport, stress kinase, defense/stress response, target protein compound in the cold response and acclimation of Lilium lancifolium . They were differentially expressed between the control 0 h, cold treatments 2 h and 16 h. The bar represents the scale of the expression levels for each gene (log10 RPKM (number of reads per kilobase per million clean reads)) in the cold response and acclimation as indicated by green/red rectangles. Green indicates up-regulation of genes and Red indicates down-regulation and no change is indicated in black. Complete information for each gene list can be found in Additional file 1: Table S1.
Figure 6
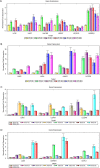
The expression profiles of 10 transcripts in Lilium lancifolium by the quantitative reverse transcription polymerase chain reaction (qRT-PCR). The Figures A and B indicated the expression of ten genes from their leaves; the Figures C and D implied the expression of six genes from their stems, roots and stems. The y-axes show normalized fold expression levels determined by qRT-PCR.
Figure 7
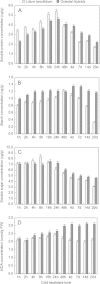
Soluble sugar, starch, soluble protein and MDA concentration per unit 4°C cold treatment (CT) of Lilium lancifolium and Oriental hybrids ’ leaves. A. Two cultivars’ soluble protein content in different stages under 4°C cold treatments B. Two cultivars’ starch content in different stages under 4°C cold treatments C. Two cultivars’ soluble sugar content in different stages under 4°C cold treatments D. Two cultivars’ MDA content in different stages under 4°C cold treatments Black squares: Lilium lancifolium; grey squares: Oriental hybrids’fructose; Bars refer to standard errors.
Figure 8
Lilium lancifolium leaf structures in different stages under 4°C cold treatments. A. Controlled 0 h(grow up in room-temperature) leaf structure; B. cold treatment 16 h leaf structure; C. cold treatment 48 h leaf structure; D. cold treatment 7 days leaf structure.
Figure 9
Electrical conductivity expression of Lilium lancifolium leaves in different stages under 4°C cold treatments.
Figure 10
Models describing the signaling pathways involved in the acquisition of cold tolerance. The red box showed the indentified genes in Lilium lancifolium transcriptome; and the blue box demonstrated the unknown transcription factors and pathways in Lilium lancifolium.
Similar articles
- De novo assembly and characterization of stress transcriptome and regulatory networks under temperature, salt and hormone stresses in Lilium lancifolium.
Wang J, Wang Q, Yang Y, Liu X, Gu J, Li W, Ma S, Lu Y. Wang J, et al. Mol Biol Rep. 2014 Dec;41(12):8231-45. doi: 10.1007/s11033-014-3725-1. Epub 2014 Sep 9. Mol Biol Rep. 2014. PMID: 25200436 - Transcriptional Regulatory Network of GA Floral Induction Pathway in LA Hybrid Lily.
Li W, Yong Y, Zhang Y, Lyu Y. Li W, et al. Int J Mol Sci. 2019 May 31;20(11):2694. doi: 10.3390/ijms20112694. Int J Mol Sci. 2019. PMID: 31159293 Free PMC article. - Transcriptome comparison reveals key candidate genes in response to vernalization of Oriental lily.
Li W, Liu X, Lu Y. Li W, et al. BMC Genomics. 2016 Aug 22;17(1):664. doi: 10.1186/s12864-016-2955-0. BMC Genomics. 2016. PMID: 27549794 Free PMC article. - Transcriptome analysis of starch and sucrose metabolism across bulb development in Sagittaria sagittifolia.
Gao M, Zhang S, Luo C, He X, Wei S, Jiang W, He F, Lin Z, Yan M, Dong W. Gao M, et al. Gene. 2018 Apr 5;649:99-112. doi: 10.1016/j.gene.2018.01.075. Epub 2018 Jan 31. Gene. 2018. PMID: 29374598 Review. - Lily breeding by using molecular tools and transformation systems.
Liu X, Gu J, Wang J, Lu Y. Liu X, et al. Mol Biol Rep. 2014 Oct;41(10):6899-908. doi: 10.1007/s11033-014-3576-9. Epub 2014 Jul 19. Mol Biol Rep. 2014. PMID: 25037269 Review.
Cited by
- Overexpression of PavbHLH28 from Prunus avium enhances tolerance to cold stress in transgenic Arabidopsis.
Cao X, Wen Z, Shen T, Cai X, Hou Q, Shang C, Qiao G. Cao X, et al. BMC Plant Biol. 2023 Dec 18;23(1):652. doi: 10.1186/s12870-023-04666-1. BMC Plant Biol. 2023. PMID: 38110865 Free PMC article. - Comparative transcriptomic analysis reveals gene expression associated with cold adaptation in the tea plant Camellia sinensis.
Li Y, Wang X, Ban Q, Zhu X, Jiang C, Wei C, Bennetzen JL. Li Y, et al. BMC Genomics. 2019 Jul 31;20(1):624. doi: 10.1186/s12864-019-5988-3. BMC Genomics. 2019. PMID: 31366321 Free PMC article. - Transcriptomic response of durum wheat to cold stress at reproductive stage.
Díaz ML, Soresi DS, Basualdo J, Cuppari SJ, Carrera A. Díaz ML, et al. Mol Biol Rep. 2019 Apr;46(2):2427-2445. doi: 10.1007/s11033-019-04704-y. Epub 2019 Feb 23. Mol Biol Rep. 2019. PMID: 30798485 - Deep sequencing-based characterization of transcriptome of trifoliate orange (Poncirus trifoliata (L.) Raf.) in response to cold stress.
Wang M, Zhang X, Liu JH. Wang M, et al. BMC Genomics. 2015 Jul 29;16(1):555. doi: 10.1186/s12864-015-1629-7. BMC Genomics. 2015. PMID: 26219960 Free PMC article.
References
- Bray EA, Bailey-Serres J, Weretilnyk E. Responses to abiotic stresses. Chapter 22. In: Gruissem W, Buchannan B, Jones R, editors. Responses to Abiotic Stresses. Rockville, MD: American Society of Plant Physiologists; 2000. pp. 1158–1249.
Publication types
MeSH terms
Substances
LinkOut - more resources
Full Text Sources
Other Literature Sources
Research Materials
Miscellaneous


