Coupling of angiogenesis and osteogenesis by a specific vessel subtype in bone - PubMed (original) (raw)
. 2014 Mar 20;507(7492):323-328.
doi: 10.1038/nature13145. Epub 2014 Mar 12.
Affiliations
- PMID: 24646994
- PMCID: PMC4943525
- DOI: 10.1038/nature13145
Coupling of angiogenesis and osteogenesis by a specific vessel subtype in bone
Anjali P Kusumbe et al. Nature. 2014.
Erratum in
- Nature. 2014 Sep 25;513(7519):574
Abstract
The mammalian skeletal system harbours a hierarchical system of mesenchymal stem cells, osteoprogenitors and osteoblasts sustaining lifelong bone formation. Osteogenesis is indispensable for the homeostatic renewal of bone as well as regenerative fracture healing, but these processes frequently decline in ageing organisms, leading to loss of bone mass and increased fracture incidence. Evidence indicates that the growth of blood vessels in bone and osteogenesis are coupled, but relatively little is known about the underlying cellular and molecular mechanisms. Here we identify a new capillary subtype in the murine skeletal system with distinct morphological, molecular and functional properties. These vessels are found in specific locations, mediate growth of the bone vasculature, generate distinct metabolic and molecular microenvironments, maintain perivascular osteoprogenitors and couple angiogenesis to osteogenesis. The abundance of these vessels and associated osteoprogenitors was strongly reduced in bone from aged animals, and pharmacological reversal of this decline allowed the restoration of bone mass.
Figures
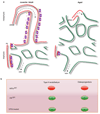
Extended Data Figure 1. Schematic representation of key findings.
a, Type H vasculature (red) in the metaphysis (mp) and endosteum (es) represents a functionally specialised vessel subtype that mediates vessel growth and promotes osteogenesis. The later is presumably mediated by angiocrine growth factors (small circles). In aged animals (right), the number of types H vessels and associated osteoprogenitors (OPs) is strongly reduced so that bone mainly contains type L, sinusoidal vessels characteristic for the diaphyseal (dp) marrow cavity. Arrows indicate the incoming arterial flow and venous drainage. b, Regulation of type H endothelium by hypoxia-inducible factor. EC-specific gene inactivation of HIF-1α led to pronounced reduction of type H ECs and osteoprogenitors, whereas the opposite effect was obtained by disrupting endothelial VHL expression. Type H ECs, associated osteoprogenitor cells and bone formation were stimulated by DFM in aged mice.
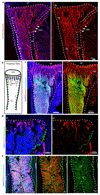
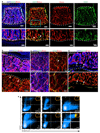
Extended Data Figure 2. Regional differences in metabolic marker expression.
a, Tile scan confocal images showing maximum intensity surface projection of Emcn (red) immunostaining on tibial bone section. Nuclei in left image are stained with DAPI (blue). Arrowheads mark the exit of the vein through the cortical bone (cb). Indicated are growth plate (gp), diaphysis (dp) and secondary ossification centre (soc). b, Schematic representation of proximal tibial bone indicating localization of different regions: secondary ossification centre (soc), growth plate (gp), metaphysis (mp), diaphysis (dp), endosteum (es). c, Representative confocal images showing pimonidazole (green) staining on a tibial section from a 5 week-old mouse. Nuclei, DAPI (blue); ECs, Endomucin (red, Emcn). Note abundance of pimonidazole staining thoughout the diaphysis (dp) but not in the metaphyseal (mp) region. Dashed lines indicate the borders of cortical bone and growth plate (gp). d, e, Maximum intensity projections of pimonidazole (green) stained 8-week old tibia. Nuclei, DAPI (blue); CD31 (red, d); CD45 (red, e). Green staining is seen in CD45+ hematopoietic cells in the diaphysis (dp) and on the bone surface (arrowheads). Dashed lines indicate the borders of cortical bone (cb) and growth plate (gp).
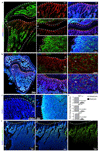
Extended Data Figure 3. Regional differences in metabolic marker expression.
a, Representative confocal images showing HIF1-α (green) and CD31 (red) immunostaining on sections of 7 week-old tibiae. Nuclei, DAPI (blue). Note abundance of HIF1α-positive nuclei in the diaphysis (dp) and secondary ossification centre (soc) but not in the metaphyseal (mp) region near the growth plate (gp). Dashed lines indicate borders of the growth plate (left and centre) or, in panels on the right, the endosteum (es). b, Maximum intensity projections of tibial sections from 7 week-old mice showing immunostaining for the indicated markers. MCT4-positive (green) cells were absent in the metaphysis (mp) but abundant in the diaphysis (dp) and secondary ossification centre (soc). c, Maximum intensity projections of Glut1 (green) immunostaining on sections of 7 week-old tibiae. Nuclei, DAPI (blue). Note abundance of Glut1-positive cells in the diaphysis (dp) but not in the metaphyseal (mp) region below the growth plate (gp). Dashed lines indicate borders of growth plate or endosteum (es), respectively. d, Quantitation of HIF1-α, MCT4 and Glut1 immunostaining intensities in metaphysis and diaphysis. Data represent mean±s.e.m (n=5 mice in two independent experiments). P values, two-tailed unpaired t-test. e, Representative tile scan confocal image showing the distribution of phospho-ERK1/2 (green) immunosignal in sections of 7 week-old tibia. Nuclei, DAPI (blue). Note prominent phospho-ERK1/2 staining of cells in the metaphysis (mp) relative to the diaphysis (dp). Dashed line indicates border of the growth plate (gp).
Extended Data Figure 4. Structural and marker heterogeneity in bone sinusoidal endothelium.
a, Representative tile scan confocal image showing maximum intensity surface projection of Endomucin (red) immunostaining of ECs in the femur of a 2 week-old mouse. Nuclei in left image are stained with DAPI (blue). Dashed lines indicate the adjacent growth plate (top), the border of the diaphysis (dp) and the morphologically distinct metaphyseal (mp) and diaphyseal (dp) vessels. b, Tile scan confocal image showing maximum intensity surface projection of GFP+ ECs in 2 week-old Flk1-GFP transgenic tibia. Left: nuclei, DAPI (blue). Dashed lines indicate the adjacent growth plate (top) or the border of the diaphysis (dp). Dashed lines mark borders of the growth plate (top) and cortical bone (left and right) as well as the interface between column-like metaphyseal (mp) vessels and the highly branched diaphyseal (dp) vasculature. c-e, Representative tile scan confocal images of the GFP+ (green) endothelium in Cdh5(PAC)-CreERT2 x Rosa26-mT/mG double transgenic tibiae from 2 week-old (c), 4 week-old (d), or 6 week-old (e) mice after postnatal tamoxifen administration. Nuclei, DAPI (blue). GFP signal is restricted to vessels and absent in chondrocytes of the growth plate (gp) or hematopoietic cells. GFP expression is restricted only to vasculature. Dashed lines indicate the borders of the growth plate, cortical bone and secondary ossification centre (soc). f, Quantitative analysis of relative CD31 and Endomucin immunostaining intensities in the microvasculature of the metaphysis, diaphysis (marrow cavity) and endosteum, as indicated. Data represent mean±s.e.m (n=7 mice from seven independent experiments). P values, two-tailed unpaired t-test. g, Mean fluorescence intensities (MFI) of CD31hi/Emcnhi and CD31lo/Emcnlo endothelial subsets as determined by flow cytometric analysis of bone marrow cells stained with CD31 and Endomucin. Data represent mean±s.e.m (n=7 mice two independent experiments). P values, two-tailed unpaired t-test.
Extended Data Figure 5. EC subsets in different skeletal elements and organs.
a-d, Representative tile scan confocal images showing CD31 (green) and Endomucin (red) immunostaining in juvenile (4 week-old) vertebra (a), sternum (b), and whole-mount (c) or sectioned (d) calvarium (parietal bone). Nuclei, DAPI (blue). Arrowheads indicate CD31hi/Emcnhi endothelium (yellow). Arrow in (a) marks an adjacent artery (green). e, Representative dot plots showing flow cytometric analysis of CD31 and Endomucin-stained single cell suspensions from kidney, heart, spleen, lung, brain, and liver. Note absence of a CD31hi/Emcnhi EC subset (orange dashed circle in Q2) in these organs with exception of liver.
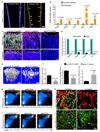
Extended Data Figure 6. Regional and age related differences in ECs and bone.
a, Confocal images showing diaphyseal region of flushed tibia immunostained for CD31 (green) and Endomucin (red). Nuclei, DAPI (blue). Note retention of type H endothelium in the endosteum after flushing. b, Comparative qPCR analysis of marrow cell suspension flushed from the tibial diaphysis and compact bone plus endosteum (harbouring type H endothelium). Shown are expression levels of Pdgfa, Pdgfb, Fgf1, Tgfb1, and Tgfb3 mRNAs relative to mRNA for β-actin. Data represent mean±s.e.m (n=6-8 mice in two independent experiments). P values, two-tailed unpaired t-test. c, Representative confocal images from metaphyseal and diaphyseal regions of tibias from mice of different ages immunostained for Osterix (green) and CD31 (red). Nuclei, DAPI (blue). Dashed lines mark the adjacent growth plate (metaphysis) or endosteum (es) in diaphysis. Note striking decline of CD31+ vessels and associated osteoprogenitors in ageing mice. d, Quantitative mRNA expression analysis of Cspg4, Pdgfrb, Runx2, and SP7 relative to transcripts encoding β-actin in long bones from juvenile and aged mice. Note significant decline of all 4 markers in bone from aged mice. Data represent mean±s.e.m (n=7 mice in two independent experiments). P values, two-tailed unpaired t-test. e, Representative μ-CT images of tibias from juvenile (5 week-old) and aged mice. Note significant loss of bone in aged mice. f, Quantitative μ-CT analysis of relative bone volume, number of trabeculae and trabecular separation (i.e., space between trabeculae) in proximal tibias from juvenile mice and aged mice. Data represent mean±s.e.m (n=5 mice in two independent experiments). P values, two-tailed unpaired t-test. g, FACS plots of CD31 and Endomucin double stained single cell suspensions from murine tibias. CD31hi/Emcnhi ECs decline with age. h, Confocal images showing type H endothelium identified as GFP+ (red) ECs and proliferation (EdU incorporation, green) in the metaphysis (mp, upper panel) or diaphysis (dp, lower panel) from 3 or 7 week-old Flk1-GFP transgenic tibia, as indicated. EdU+ proliferating GFP+ cells (arrowheads), which represent type H endothelium, are abundant in the metaphysis (mp) of juvenile mice and but not adult mice. EdU+/GFP+ECs are sparse in sinusoidal (type L) vessels of the diaphysis. i, FACS plots showing CD31 and endomucin double staining of single cell suspensions from juvenile, adult and aged mice livers. CD31hi/Emcnhi ECs in liver do not decline with age.
Extended Data Figure 7. Lineage tracing of type H endothelium and analysis of HIF pathway mutants.
a-b, Representative confocal images of sectioned tibiae from the genetic lineage tracing experiment analysed at 1 and 40 days after tamoxifen administration. GFP-labelled ECs (green) seen in Cdh5(PAC)-CreERT2 x Rosa26-mT/mG double transgenics after 1 day correspond arteries and type H endothelium (arrowheads) in the metaphysis (mp) and endosteum, but not in sinusoidal vessels of the diaphysis (dp). Counterstaining of ECs with anti-Endomucin antibody (red fluorescence) in samples taken after 40 days shows expansion of the GFP+ endothelium into the diaphyseal microvasculature. Nuclei in small insets in (a), DAPI (blue). Dashed lines indicate border of growth plate (gp) and outline of compact bone. c, Representative confocal images of metaphyseal (mp) region in tibiae from the genetic lineage tracing experiment analysed at day 40 after tamoxifen administration showing GFP-labelled ECs (green) in Cdh5(PAC)-CreERT2 x Rosa26-mT/mG double transgenics and Osterix staining (white). Nuclei stained with DAPI (blue). Dashed lines drawn below chondrocytes (ch) lines indicate border of growth plate (gp). d-e, Quantitative analysis of CD31hi/Emcnhi ECs in long bone from _Hif1a_iΔEC and corresponding littermate controls analysed at postnatal day 20 (P20, d) or P37 (e). Shown is fold change in frequency of ECs CD31hi/Emcnhi ECs identified by flow cytometry. Data represent mean±s.e.m (n=7 mice from three independent experiments d; n=6 mice from three independent experiments e). P values, two-tailed unpaired t-test. f, Quantitative analysis of CD31hi/Emcnhi ECs in long bone from _Vhl_iΔEC and corresponding littermate controls analysed at postnatal day (P20). Shown is fold change in frequency of ECs CD31hi/Emcnhi ECs identified by flow cytometry. Data represent mean±s.e.m (n=5 mice from three independent experiments). P values, two-tailed unpaired t-test. g, Representative tile scan confocal images from tibia sections of control and _Vhl_iΔEC mutants immunostained for Endomucin (red) and Osteopontin (green). Nuclei, DAPI (blue). Note widespread osteopontin staining in _Vhl_iΔEC mutant tibia. gp, growth plate; mp, metaphysis; dp, diaphysis; es, endosteum.
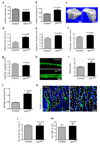
Extended Data Figure 8. _Vhl_iΔEC mutants show increased bone mass.
a-b, Serum alkaline phosphate levels in _Hif1a_iΔEC (a) and _Vhl_iΔEC (b) mutants. Data represent mean±s.e.m (n=5-6 mice for _Hif1a_iΔEC mice from three independent experiments; n=6 mice for _Vhl_iΔEC from three independent experiments). P values, twotailed unpaired t-test. c, Representative μ-CT images of tibias from _Vhl_iΔEC mutants and littermate controls. d-g, Quantitative μ-CT analysis of relative bone volume (d), trabecular thickness (e) trabecular number (f), and trabecular separation (g) in proximal tibia from _Vhl_iΔEC mutants and their littermate controls. Data represent mean±s.e.m (n=4 mice from from two independent experiments). P values, two-tailed unpaired t-test. Note increased bone mass in _Vhl_iΔEC mutants. h, Calcein double labelling of 5 week-old _Vhl_iΔEC mutant and littermate control tibiae. i-j, Quantitative analysis of bone formation parameters. Mineral apposition rate [MAR; (i)] and bone formation rate/bone surface [BFR/BS; (j)] for _Vhl_iΔEC mutants and controls. Data represent mean±s.e.m (n=6-7 mice from three independent experiments). P values, two-tailed unpaired t-test. k, Representative confocal images showing Calcitonin receptor staining (osteoclasts) in tibia sections from _Vhl_iΔEC mutants and littermate controls. Nuclei, DAPI (blue). l-m, Histological analysis of _Vhl_iΔEC and control tibiae showing osteoclast number/bone perimeter [No. Oc./B. Pm; (l)] and osteoclast surface/bone surface [Oc. S/B. S; (m)]. Data represent mean±s.e.m (n=6 mice from three independent experiments). P values, two-tailed unpaired t-test.
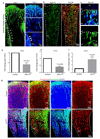
Extended Data Figure 9. Age-dependent endothelial HIF1-α expression.
a, Representative confocal images showing HIF1-α (green) and CD31 (red) immunostaining on sections of 2 week-old tibia. Nuclei, DAPI (blue). Note abundance of HIF1-α-positive type H ECs in 2 week-old metaphysis (mp) but not in the type L endothelium in diaphysis (dp). Dashed line marks border of growth plate (gp). b, Quantitative mRNA expression analysis of Hif1a transcripts relative to mRNA encoding β-actin in type H and type L. Data represent mean±s.e.m (n=3 biological replicates). P values, two-tailed unpaired t-test. c, d, Maximum intensity projections of HIF1-α (green) and CD31 (red) immunostaining in 7 week-old (c) and 61 week-old (d) tibiae. Nuclei, DAPI (blue). HIF1-α-positive endothelium was not detected in metaphysis (mp) of 7 week-old (c) and 61 week-old tibia (d). e, Maximum intensity confocal images from the diaphysis of 5 week-old Flk1-GFP (green) irradiated (900 rads) and control tibiae after HIF1-α (red) immunostaining. HIF1-α signals (arrowheads) in GFP+ ECs are enhanced after irradiation. f, qPCR expression analysis of Hif1a relative to transcripts encoding β-actin in sorted ECs from bones of irradiated mice and untreated controls. Data represent mean±s.e.m (n=7 mice from three independent experiments). P values, two-tailed unpaired t-test.
Extended Data Figure 10. DFM induction of type H ECs and osteoprogenitors.
a, b, Representative confocal images of CD31 (red, a, b) or Osterix (green, b) stained tibia sections from aged DFM-treated and control mice (60-65 weeks old). Low intensity projection shows only CD31hi cells. DFM induces CD31hi vessels and Osterix+ osteoprogenitors. Chondrocytes, ch. c, Tile scan confocal images of CD31 (red) and Osterix (green, Osx) from metaphysis region of stained tibia sections from aged DFM-treated and control mice. Low intensity projection shows only CD31hi cells. DFM induces CD31hi vessels and Osterix+ osteoprogenitors. Nuclei, DAPI (blue). Dashed lines mark growth plate chondrocytes (ch) and outline of compact bone. Arrowheads indicate Osterix+ cells in secondary ossification centre (soc) and DFM-treated metaphysis. d, Quantitation of Osterix+ osteoprogenitor cells in DFM treated and control parietal bones. Data represent mean±s.e.m (n=6 mice from mice from two independent experiments). P values, two-tailed unpaired t-test. e, qPCR analysis of Ibsp, Sp7, Bglap and mRNA expression levels relative to Actb in the aged DFM or vehicle-treated (Control) parietal bones, as indicated. Data represent mean±s.e.m (n=6-7 mice from two independent experiments)). P values, two-tailed unpaired t-test.
Figure 1
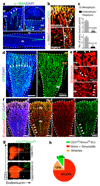
Identification of bone vessel subtypes. a, Confocal images showing α-SMA+ arteries (green) in thick sections (300μm) of juvenile 4 week-old tibia. Nuclei, DAPI (blue). Arteries enter through the cortex (red arrowhead), terminate in endosteum (yellow), and branch in the metaphysis (mp) or diaphysis (dp) (white). Dashed lines mark growth plate (gp) or endosteum (es). b, α-SMA+ (white) arteries and α-SMA- CD31+ (green) Emcn- (red) arterioles terminate in CD31+ Emcn+ capillaries within metaphysis and endosteum (es). c, Quantitation of α-SMA+ (top) and CD31+/Emcn- (bottom) arterial branch points in 4 week-old tibia. Data represent mean±s.e.m (n=6 mice for quantification of α-SMA+ arterial branch points from six independent experiments and n=4 for quantification of CD31+/Emcn- arterial branch points; both from four independent experiments). P values, two-tailed unpaired _t_-tests. d, Representative tile scans of GFP+ (green) endothelium in juvenile Cdh5(PAC)-CreERT2 x Rosa26-mT/mG mouse tibia. Yellow dashed line marks growth plate (gp). Note distinct organisation and interconnections (arrowheads) of microvessels in metaphysis (mp) and diaphysis (dp). e, Maximum intensity projections of EC columns in metaphysis (mp, arrowheads mark distal protrusions), which are connected (arrowheads in central panel) to highly branched sinusoids in diaphysis (dp). f, Confocal tile scan of juvenile 3 week-old tibia showing CD31+ (green) and Emcn+ (red) ECs in metaphysis (mp) and endosteum (arrowheads). g, Representative flow cytometry dot plots showing CD31hi/Emcnhi ECs in lineage (Lin) depleted bone marrow cells (BMCs). h, Relative abundance of EC subtypes in 4 week-old long bone. CD31hi/Emcnhi cells represent 1.77±0.01% (mean ± s.d.m, n=7 mice from three independent experiments) of total ECs.
Figure 2
Osteoprogenitor association with type H ECs. a. Confocal images of 4 week-old tibia with indicated stainings. Growth plate (gp) and bone marrow cavity (bm) are marked. Osterix+ cells are found around CD31hi/Emcnhi vessels in metaphysis and endosteum (arrowheads) b, Collagen1α+ cells (green) surround columnar CD31+ vessels (red) but not CD31-Emcn+ type L bone marrow (bm) sinusoids in 3 week-old mouse tibia. c, Immunostained 4 week-old tibia showing association of Runx2+ osteoprogenitors (green) with CD31+ (red) vessels in metaphysis and endosteum (es). Minimum exposure was used to capture only cells with high CD31 fluorescence in (a-c). d, Quantitative analysis of proximity (≤20μm) of Runx2+, Collagen1α+ (Col1α) and Osterix+ (Osx) to nearest type H vessel. Mean±s.e.m, n=5 mice from three independent experiments. e, Maximum intensity projection of PDGFRβ+ cells (green) next to CD31+ (red) metaphyseal columns and distal arches (asterisks), and close to endosteal (es) type H ECs. PDGFRβ also marked arteries and rare cells (arrowheads) associated with Emcn+ type L bone marrow (bm) sinusoids (right).
Figure 3
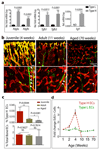
Properties and age-dependent decline of type H ECs. a, qPCR analysis of growth factor expression (normalised to Actb) by CD31hi/Emcnhi ECs relative to CD31lo/Emcnlo ECs sorted from murine tibia. Data represent mean±s.e.m (n=3 biological replicates). P values, two-tailed unpaired t-test. b, Confocal images of CD31 (green) and Emcn (red) immunostained tibia sections at 4, 11 and 70 weeks. Note age-dependent decline of CD31hi/Emcnhi ECs in metaphysis (top row) and endosteum (es, arrowheads). c, Flow cytometric quantitation of CD31hi/Emcnhi ECs from long bone of the indicated age group. Total ECs were not significantly changed (bottom). Data represent mean±s.e.m (n=7 mice from three independent experiments). d, Fold change in EdU+ type H and type L EC numbers in murine tibia at indicated ages determined by flow cytometry. Data represent mean±s.e.m (n=7 mice from two independent experiments).
Figure 4
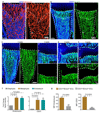
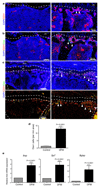
Type H ECs mediate bone vessel growth. a, Maximum intensity projection showing restricted GFP labelling (green) of arteries and CD31hi/Emcnhi vessels in 4 week-old Cdh5(PAC)-CreERT2 x ROSA26-mT/mG tibia at day 1 after tamoxifen administration (left). At day 40, GFP+ ECs were found throughout the metaphysis (mp) and diaphysis (dp, arrowheads). Nuclei, DAPI (blue). b, Quantitation of type H and type L ECs in long bone at day 7 after sublethal irradiation. Data represent mean±s.e.m (n=16 mice, two independent experiments). P values, two-tailed unpaired t-test. Bottom panels show representative images of control and irradiated diaphysis. CD31hi/Emcnhi ECs (arrowheads) were found throughout the diaphysis after irradiation. c, d, Maximum intensity projections of immunostained, 3 week-old _Hif1a_iΔEC (c) or _Vhl_iΔEC tibiae (d) with littermate controls. Note reduction of CD31hi/Emcnhi ECs (arrowheads) in _Hif1a_iΔEC metaphysis (mp) and expansion in _Vhl_iΔEC samples. Growth plate, gp; Diaphysis, dp.
Figure 5
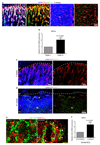
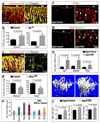
Type H ECs couple angiogenesis and osteogenesis. a, Confocal images of CD31 (green), Endomucin (red) and Osterix (white) immunostained, 3 week-old _Vhl_iΔEC and control tibiae. b, Quantitation of Runx2+ and Osterix+ (Osx) cells in _Vhl_iΔEC mutants and controls. Data represent mean±s.e.m (n=5 mice in two independent experiments. P values, twotailed unpaired t-test. c, Maximum intensity projections of 3 week-old _Hif1a_iΔEC and control tibia stained for CD31 (green), Endomucin (red) and Osterix (white). Growth plate, gp. d, Quantitation of Runx2+ and Osterix+ cells in _Hif1a_iΔEC mutant and control long bone. Data represent mean±s.e.m (n=5 mice in three independent experiments). P values, two-tailed unpaired t-test. e, qPCR mRNA analysis of DFM or vehicle-treated bone endothelial cells (BECs). Data represent mean±s.e.m (n=3 biological replicates). Note induction of growth factor expression by DFM. f, g, Representative images of CD31 (red, f, g) and Osterix (green, g) stained tibia sections from aged DFM-treated and control mice. Low intensity projection shows only CD31hi cells. DFM induces CD31hi vessels and Osterix+ osteoprogenitors. Chondrocytes, ch. h, qPCR analysis of Sp7 (encoding Osterix), Bglap (bone gamma-carboxyglutamate protein) and Ibsp (integrin-binding sialoprotein) mRNA expression relative to Actb in the aged DFM-treated or vehicle control femur. Data represent mean±s.e.m (n=6-8 mice in four independent experiments). P values, two-tailed unpaired t-test. i, Representative μ-CT images of aged DFM-treated and control tibiae. j, Quantitative μ-CT analysis of relative bone volume (Rel. BV), trabecular number (Tb. Nb), and trabecular thickness (Tb. Thickness) in proximal tibia. Data represent mean±s.e.m (n=5 mice in two independent experiments). P values, two-tailed unpaired t-test.
Comment in
- Bone. Formation of blood vessels in bone maturation and regeneration.
Greenhill C. Greenhill C. Nat Rev Endocrinol. 2014 May;10(5):250. doi: 10.1038/nrendo.2014.28. Epub 2014 Mar 18. Nat Rev Endocrinol. 2014. PMID: 24637855 No abstract available. - Bone biology: Vessels of rejuvenation.
le Noble F, le Noble J. le Noble F, et al. Nature. 2014 Mar 20;507(7492):313-4. doi: 10.1038/nature13210. Epub 2014 Mar 12. Nature. 2014. PMID: 24646993 No abstract available.
Similar articles
- Unique bone marrow blood vessels couple angiogenesis and osteogenesis in bone homeostasis and diseases.
Zhao Y, Xie L. Zhao Y, et al. Ann N Y Acad Sci. 2020 Aug;1474(1):5-14. doi: 10.1111/nyas.14348. Epub 2020 Apr 3. Ann N Y Acad Sci. 2020. PMID: 32242943 Review. - Blood vessel formation and function in bone.
Sivaraj KK, Adams RH. Sivaraj KK, et al. Development. 2016 Aug 1;143(15):2706-15. doi: 10.1242/dev.136861. Development. 2016. PMID: 27486231 Review. - Endothelial Notch activity promotes angiogenesis and osteogenesis in bone.
Ramasamy SK, Kusumbe AP, Wang L, Adams RH. Ramasamy SK, et al. Nature. 2014 Mar 20;507(7492):376-380. doi: 10.1038/nature13146. Epub 2014 Mar 12. Nature. 2014. PMID: 24647000 Free PMC article. - Biology of Bone: The Vasculature of the Skeletal System.
Watson EC, Adams RH. Watson EC, et al. Cold Spring Harb Perspect Med. 2018 Jul 2;8(7):a031559. doi: 10.1101/cshperspect.a031559. Cold Spring Harb Perspect Med. 2018. PMID: 28893838 Free PMC article. Review. - Motivating role of type H vessels in bone regeneration.
Zhang J, Pan J, Jing W. Zhang J, et al. Cell Prolif. 2020 Sep;53(9):e12874. doi: 10.1111/cpr.12874. Epub 2020 Jul 19. Cell Prolif. 2020. PMID: 33448495 Free PMC article. Review.
Cited by
- Regulation of tissue morphogenesis by endothelial cell-derived signals.
Ramasamy SK, Kusumbe AP, Adams RH. Ramasamy SK, et al. Trends Cell Biol. 2015 Mar;25(3):148-57. doi: 10.1016/j.tcb.2014.11.007. Epub 2014 Dec 17. Trends Cell Biol. 2015. PMID: 25529933 Free PMC article. Review. - Integration of single-cell transcriptomes and biological function reveals distinct behavioral patterns in bone marrow endothelium.
Kim YW, Zara G, Kang H, Branciamore S, O'Meally D, Feng Y, Kuan CY, Luo Y, Nelson MS, Brummer AB, Rockne R, Chen ZB, Zheng Y, Cardoso AA, Carlesso N. Kim YW, et al. Nat Commun. 2022 Nov 24;13(1):7235. doi: 10.1038/s41467-022-34425-z. Nat Commun. 2022. PMID: 36433940 Free PMC article. - Bone-targeted pH-responsive cerium nanoparticles for anabolic therapy in osteoporosis.
Dou C, Li J, He J, Luo F, Yu T, Dai Q, Chen Y, Xu J, Yang X, Dong S. Dou C, et al. Bioact Mater. 2021 May 20;6(12):4697-4706. doi: 10.1016/j.bioactmat.2021.04.038. eCollection 2021 Dec. Bioact Mater. 2021. PMID: 34095626 Free PMC article. - Impairment of type H vessels by NOX2-mediated endothelial oxidative stress: critical mechanisms and therapeutic targets for bone fragility in streptozotocin-induced type 1 diabetic mice.
Hu XF, Xiang G, Wang TJ, Ma YB, Zhang Y, Yan YB, Zhao X, Wu ZX, Feng YF, Lei W. Hu XF, et al. Theranostics. 2021 Jan 30;11(8):3796-3812. doi: 10.7150/thno.50907. eCollection 2021. Theranostics. 2021. PMID: 33664862 Free PMC article. - Circular RNA-ABCB10 promotes angiogenesis induced by conditioned medium from human amnion-derived mesenchymal stem cells via the microRNA-29b-3p/vascular endothelial growth factor A axis.
Tang Z, Tan J, Yuan X, Zhou Q, Yuan Z, Chen N, Shen M. Tang Z, et al. Exp Ther Med. 2020 Sep;20(3):2021-2030. doi: 10.3892/etm.2020.8939. Epub 2020 Jun 25. Exp Ther Med. 2020. PMID: 32782512 Free PMC article.
References
- Tashiro Y, et al. Inhibition of PAI-1 induces neutrophil-driven neoangiogenesis and promotes tissue regeneration via production of angiocrine factors in mice. Blood. 2012;119:6382–6393. - PubMed
- Red-Horse K, Crawford Y, Shojaei F, Ferrara N. Endothelium-microenvironment interactions in the developing embryo and in the adult. Dev Cell. 2007;12:181–194. - PubMed
- Ribatti D, Nico B, Vacca A, Roncali L, Dammacco F. Endothelial cell heterogeneity and organ specificity. J Hematother Stem Cell Res. 2002;11:81–90. - PubMed
Publication types
MeSH terms
Substances
LinkOut - more resources
Full Text Sources
Other Literature Sources
Molecular Biology Databases
