Enriched housing enhances recovery of limb placement ability and reduces aggrecan-containing perineuronal nets in the rat somatosensory cortex after experimental stroke - PubMed (original) (raw)
Enriched housing enhances recovery of limb placement ability and reduces aggrecan-containing perineuronal nets in the rat somatosensory cortex after experimental stroke
Alexandre Madinier et al. PLoS One. 2014.
Abstract
Stroke causes life long disabilities where few therapeutic options are available. Using electrical and magnetic stimulation of the brain and physical rehabilitation, recovery of brain function can be enhanced even late after stroke. Animal models support this notion, and housing rodents in an enriched environment (EE) several days after experimental stroke stimulates lost brain function by multisensory mechanisms. We studied the dynamics of functional recovery of rats with a lesion to the fore and hind limb motor areas induced by photothrombosis (PT), and with subsequent housing in either standard (STD) or EE. In this model, skilled motor function is not significantly enhanced by enriched housing, while the speed of recovery of sensori-motor function substantially improves over the 9-week study period. In particular, this stroke lesion completely obliterates the fore and hind limb placing ability when visual and whisker guidance is prevented, a deficit that persists for up to 9 weeks of recovery, but that is markedly restored within 2 weeks by enriched housing. Enriched housing after stroke also leads to a significant loss of perineuronal net (PNN) immunoreactivity; detection of aggrecan protein backbone with AB1031 antibody was decreased by 13-22%, and labelling of a glycan moiety of aggrecan with Cat-315 antibody was reduced by 25-30% in the peri-infarct area and in the somatosensory cortex, respectively. The majority of these cells are parvalbumin/GABA inhibitory interneurons that are important in sensori-information processing. We conclude that damage to the fore and hind limb motor areas provides a model of loss of limb placing response without visual guidance, a deficit also seen in more than 50% of stroke patients. This loss is amenable to recovery induced by multiple sensory stimulation and correlates with a decrease in aggrecan-containing PNNs around inhibitory interneurons. Modulating the PNN structure after ischemic damage may provide new therapies enhancing tactile/proprioceptive function after stroke.
Conflict of interest statement
Competing Interests: The authors have declared that no competing interests exist.
Figures
Figure 1. Experimental design.
Rats were trained, and baseline values set for the different functional tests. Rats were then subjected to PT and the functional deficits assessed 2 days later. Subsequently, rats were placed either in standard (STD) or enriched environment (EE). Functional tests were regularly performed during 9 weeks following the onset of the stroke (the time of the different tests are represented by color dots). At 9 weeks, rats were perfusion fixed and brains were analyzed by immunohistochemistry.
Figure 2. Infarct Volume.
Infarct volume was measured at 9 weeks after PT, and estimated by integration of the lesioned area on brain slices taken every 1-caudal brain axis. NeuN staining was performed to discriminate between intact and infarcted tissue. (A) Successive coronal slides of a representative brain infarct with their respective distances from the bregma for the STD housed animals, and (B) EE housed animals. (C) Infarct volume expressed as percentage of the hemisphere. Values are presented in box plots: median; 1st quartile to 3rd quartile; minimum and maximum value. (n = 7 for each housing condition; STD: standard environment, EE: enriched environment).
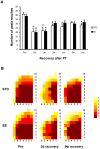
Figure 3. Skilled reaching test.
Skilled reaching test at different times of recovery after PT stroke for animals housed in standard (STD) and enriched environment (EE). (A) The total number of pasta pieces reached during 20 minutes prior to PT (pre) and at different time points after PT. (#: p<0.05 when compared to the respective group before stroke (pre). (B) Map of the reaching area presenting the number of animals (as indicated by colors) that reached the pasta pieces (n = 7 for each housing condition).
Figure 4. Effect of stroke on gait.
Presentation of gait parameters and the changes induced by PT. (A) Principle of the Catwalk. Rats run on a glass plate illuminated from the side. When the paws press the plate, light is diffracted and captured by a camera below the glass plate. The calculation of the gait parameters require the following steps: 1) the runs are recorded, 2) the light spots are associated with their respective paws, 3) the sequence of paw contact with the glass plate over time is determined and 4) the different gait parameters are calculated. (B) Stroke induces changes in different gait parameters. Here are summarized the general effect of stroke on gait two days after stroke. (C) Stroke also induces an asymmetry between left and right side in some gait parameters. The colored boxes represent time fractions when the paws are in contact with the surface of the glass plate. The black lines represent the values before stroke and the red lines the direction as well as increase or decrease of the values at 2 days after stroke (LH: left hind limb, RH: right hind limb). For details see Table S3.
Figure 5. Neuroscore.
The normal neuroscore before stroke is 28. Values at different times after PT in rats subsequently housed in standard (STD) and enriched environment (EE) are presented in box plot: median; 1st quartile to 3rd quartile, minimum and maximum value. (n = 7 for each housing condition) (*: p<0.05 when STD compared to EE; #: p<0.05 when STD and EE where compared to the respective values before stroke).
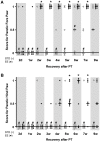
Figure 6. The whisker-paw test.
(A) Ipsilateral whisker test, and (B) cross-midline whisker test of rats subjected to PT at various times of recovery. Animals were placed in a standard (STD) or an enriched (EE) environment at 2 days after stroke. The normal score before stroke for rats is 10. Each dot corresponds to a rat value and the black line corresponds to the median value for the group. (n = 7 for each housing condition) (*: p<0.05 when STD compared to EE; #: p<0.05 when STD and EE where compared to the respective values before stroke).
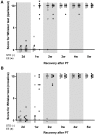
Figure 7. Paw placement test.
Limb placing ability of rats subjected to PT under conditions that prevented visual and whisker/chin stimulation during testing. (A) Fore paw placement, and (B) hind paw placement. The normal score before stroke for rats is 1. Each dot corresponds to a rat value and the black line corresponds to the median value for the group. (n = 7 for each housing condition) (*: p<0.05 when STD compared to EE; #: p<0.05 when STD and EE where compared to the respective values before stroke; STD: standard environment, EE: enriched environment).
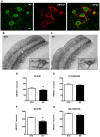
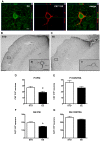
Figure 8. Environmental stimulation decreases the number of AB1031+ PV/GABA neurons in the rat cerebral cortex after PT.
(A) Confocal images of parvalbumin expressing cells (green) enwrapped by AB1031+ PNNs (red) in the somatosensory cortex of a representative STD animal, scale bar 20 μm. (B and C) Representative bright-field micrographs of AB1031+ PNNs in the rat cerebral cortex ipsilateral to the lesion, scale bar 100 μm; (B1 and C1) higher magnification, scale bar 20 μm. AB1031 immunoreactivity in (B) STD and (C) EE conditions. Quantification of cortical neurons bearing AB1031+ PNNs in the peri-infarct cortex (D), the corresponding area contralateral to the lesion (E), the ipsilateral somatosensory cortex (F) and the contralateral somatosensory cortex (G). (n = 7 for each housing condition; 9 weeks after stroke; D with *p = 0.04; E with p = 0.3613; F with *p = 0.007; G with p = 0.0963; STD: standard environment, EE: enriched environment, PI: peri-infarct cortex, SS: somatosensory cortex, IPSI: ipsilateral, CONTRA: contralateral).
Figure 9. Enriched housing decreases the number of Cat-315+ PV/GABA neurons in the rat cerebral cortex after PT.
(A) Confocal images of a parvalbumin (PV) expressing cell (green) enwrapped by a Cat-315+ PNN (red) in the somatosensory cortex of a representative STD animal; Z-stack demonstrates close proximity of the Cat-315 aggrecan antibody and PV, scale bar 20 μm. (B and C) Representative bright-field micrographs of Cat-315+ PNNs in the rat cerebral cortex ipsilateral to the lesion, scale bar 100 μm; (B1 and C1) higher magnification, scale bar 20 μm. Cat-315 immunoreactivity denotes a critical difference between (B) STD and (C) EE conditions. Quantification of cortical neurons bearing Cat-315+ PNNs in the peri-infarct cortex (D), the corresponding area contralateral to the lesion (E), the ipsilateral somatosensory cortex (F) and the contralateral somatosensory cortex (G). (n = 7 for each housing condition; 9 weeks after stroke; D with *p = 0.04; E with p = 0.06; F with *p = 0.0007; G with p = 0.1; STD: standard environment, EE: enriched environment, PI: peri-infarct cortex, SS: somatosensory cortex, IPSI: ipsilateral, CONTRA: contralateral).
Similar articles
- Multisensory stimulation improves functional recovery and resting-state functional connectivity in the mouse brain after stroke.
Hakon J, Quattromani MJ, Sjölund C, Tomasevic G, Carey L, Lee JM, Ruscher K, Wieloch T, Bauer AQ. Hakon J, et al. Neuroimage Clin. 2017 Dec 2;17:717-730. doi: 10.1016/j.nicl.2017.11.022. eCollection 2018. Neuroimage Clin. 2017. PMID: 29264113 Free PMC article. - Extracellular Matrix Modulation Is Driven by Experience-Dependent Plasticity During Stroke Recovery.
Quattromani MJ, Pruvost M, Guerreiro C, Backlund F, Englund E, Aspberg A, Jaworski T, Hakon J, Ruscher K, Kaczmarek L, Vivien D, Wieloch T. Quattromani MJ, et al. Mol Neurobiol. 2018 Mar;55(3):2196-2213. doi: 10.1007/s12035-017-0461-2. Epub 2017 Mar 13. Mol Neurobiol. 2018. PMID: 28290150 Free PMC article. - Changes in resting-state functional connectivity after stroke in a mouse brain lacking extracellular matrix components.
Quattromani MJ, Hakon J, Rauch U, Bauer AQ, Wieloch T. Quattromani MJ, et al. Neurobiol Dis. 2018 Apr;112:91-105. doi: 10.1016/j.nbd.2018.01.011. Epub 2018 Jan 31. Neurobiol Dis. 2018. PMID: 29367009 Free PMC article. - Remapping the somatosensory cortex after stroke: insight from imaging the synapse to network.
Winship IR, Murphy TH. Winship IR, et al. Neuroscientist. 2009 Oct;15(5):507-24. doi: 10.1177/1073858409333076. Epub 2009 Jul 21. Neuroscientist. 2009. PMID: 19622841 Review. - The State-of-the-Science on Somatosensory Function and Its Impact on Daily Life in Adults and Older Adults, and Following Stroke: A Scoping Review.
Carey LM, Lamp G, Turville M. Carey LM, et al. OTJR (Thorofare N J). 2016 Apr;36(2 Suppl):27S-41S. doi: 10.1177/1539449216643941. OTJR (Thorofare N J). 2016. PMID: 27504989
Cited by
- Effects of adolescent intermittent ethanol exposure on cortical perineuronal net and parvalbumin expression in adulthood mediate behavioral inflexibility.
Sullivan EDK, Dannenhoffer CA, Sutherland EB, Vidrascu EM, Gómez-A A, Boettiger CA, Robinson DL. Sullivan EDK, et al. Alcohol Clin Exp Res (Hoboken). 2024 Aug;48(8):1507-1518. doi: 10.1111/acer.15395. Epub 2024 Jul 28. Alcohol Clin Exp Res (Hoboken). 2024. PMID: 39073296 - Is Environmental Enrichment Ready for Clinical Application in Human Post-stroke Rehabilitation?
McDonald MW, Hayward KS, Rosbergen ICM, Jeffers MS, Corbett D. McDonald MW, et al. Front Behav Neurosci. 2018 Jul 11;12:135. doi: 10.3389/fnbeh.2018.00135. eCollection 2018. Front Behav Neurosci. 2018. PMID: 30050416 Free PMC article. - Focal lesion size poorly correlates with motor function after experimental traumatic brain injury in mice.
Walter J, Mende J, Hutagalung S, Grutza M, Younsi A, Zheng G, Unterberg AW, Zweckberger K. Walter J, et al. PLoS One. 2022 Mar 16;17(3):e0265448. doi: 10.1371/journal.pone.0265448. eCollection 2022. PLoS One. 2022. PMID: 35294482 Free PMC article. - Update on Perineuronal Net Staining With Wisteria floribunda Agglutinin (WFA).
Härtig W, Meinicke A, Michalski D, Schob S, Jäger C. Härtig W, et al. Front Integr Neurosci. 2022 Apr 1;16:851988. doi: 10.3389/fnint.2022.851988. eCollection 2022. Front Integr Neurosci. 2022. PMID: 35431825 Free PMC article. - Translational Value of Skilled Reaching Assessment in Clinical and Preclinical Studies on Motor Recovery After Stroke.
van Lieshout ECC, Boonzaier J, Pel AJ, van Heijningen CL, Vink JJ, Visser-Meily JMA, van Tilborg GAF, Dijkhuizen RM. van Lieshout ECC, et al. Neurorehabil Neural Repair. 2021 May;35(5):457-467. doi: 10.1177/15459683211005022. Epub 2021 Apr 7. Neurorehabil Neural Repair. 2021. PMID: 33825580 Free PMC article.
References
- Jørgensen HS, Nakayama H, Raaschou HO, Vive Larsen J, Støier M, et al. (1995) Outcome and time course of recovery in stroke. Part I: Outcome. The Copenhagen Stroke Study. Arch Phys Med Rehabil 76: 399–405. - PubMed
- Carey LM, Oke LE, Matyas TA (1996) Impaired limb position sense after stroke: a quantitative test for clinical use. Arch Phys Med Rehabil 77: 1271–1278. - PubMed
- Duncan PW, Goldstein LB, Matchar D, Divine GW, Feussner J (1992) Measurement of motor recovery after stroke. Outcome assessment and sample size requirements. Stroke 23: 1084–1089. - PubMed
- Muntner P, Garrett E, Klag MJ, Coresh J (2002) Trends in stroke prevalence between 1973 and 1991 in the US population 25 to 74 years of age. Stroke 33: 1209–1213. - PubMed
Publication types
MeSH terms
Substances
LinkOut - more resources
Full Text Sources
Other Literature Sources
Medical
Research Materials
Miscellaneous


