Phosphorylation modulates clearance of alpha-synuclein inclusions in a yeast model of Parkinson's disease - PubMed (original) (raw)
. 2014 May 8;10(5):e1004302.
doi: 10.1371/journal.pgen.1004302. eCollection 2014 May.
Madalena M Reimão-Pinto 1, Pedro Antas 1, José Rino 1, Donata Wawrzycka 2, Diana Macedo 3, Rita Rosado-Ramos 1, Triana Amen 4, Meytal Waiss 4, Filipa Magalhães 1, Andreia Gomes 5, Cláudia N Santos 5, Daniel Kaganovich 4, Tiago Fleming Outeiro 6
Affiliations
- PMID: 24810576
- PMCID: PMC4014446
- DOI: 10.1371/journal.pgen.1004302
Phosphorylation modulates clearance of alpha-synuclein inclusions in a yeast model of Parkinson's disease
Sandra Tenreiro et al. PLoS Genet. 2014.
Abstract
Alpha-synuclein (aSyn) is the main component of proteinaceous inclusions known as Lewy bodies (LBs), the typical pathological hallmark of Parkinson's disease (PD) and other synucleinopathies. Although aSyn is phosphorylated at low levels under physiological conditions, it is estimated that ∼ 90% of aSyn in LBs is phosphorylated at S129 (pS129). Nevertheless, the significance of pS129 in the biology of aSyn and in PD pathogenesis is still controversial. Here, we harnessed the power of budding yeast in order to assess the implications of phosphorylation on aSyn cytotoxicity, aggregation and sub-cellular distribution. We found that aSyn is phosphorylated on S129 by endogenous kinases. Interestingly, phosphorylation reduced aSyn toxicity and the percentage of cells with cytosolic inclusions, in comparison to cells expressing mutant forms of aSyn (S129A or S129G) that mimic the unphosphorylated form of aSyn. Using high-resolution 4D imaging and fluorescence recovery after photobleaching (FRAP) in live cells, we compared the dynamics of WT and S129A mutant aSyn. While WT aSyn inclusions were very homogeneous, inclusions formed by S129A aSyn were larger and showed FRAP heterogeneity. Upon blockade of aSyn expression, cells were able to clear the inclusions formed by WT aSyn. However, this process was much slower for the inclusions formed by S129A aSyn. Interestingly, whereas the accumulation of WT aSyn led to a marked induction of autophagy, cells expressing the S129A mutant failed to activate this protein quality control pathway. The finding that the phosphorylation state of aSyn on S129 can alter the ability of cells to clear aSyn inclusions provides important insight into the role that this posttranslational modification may have in the pathogenesis of PD and other synucleinopathies, opening novel avenues for investigating the molecular basis of these disorders and for the development of therapeutic strategies.
Conflict of interest statement
The authors have declared that no competing interests exist.
Figures
Figure 1. S129A aSyn is more toxic for yeast cells than the WT aSyn.
(A) Growth curve based on culture OD600nm of yeast cells expressing WT (□), S129A (▴) or S129E (○) aSyn-GFP, compared to cells that are not expressing the human protein (◊). Cells used as inoculum were exponential-phase cells cultivated in raffinose medium that at time zero were transferred to galactose medium to induce aSyn-GFP expression. (B) aSyn-GFP versus Propidium Iodide (PI) fluorescence and Frequency of PI and GFP positive cells assessed by flow cytometry, in the indicated yeast cells, after 6 hours of aSyn expression induction (***p<0.001; one way ANOVA with Bonferroni's multiple comparison test). A representative result is shown from at least five independent experiments. Values represent the mean ± SD.
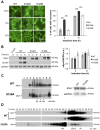
Figure 2. S129A aSyn forms more inclusions and oligomeric species with higher molecular weight than the WT form.
(A) Intracellular localization of the WT, S129A or S129E aSyn-GFP (left panel) and percentage of yeast cells containing aSyn-GFP inclusions (right panel), assessed by fluorescence microscopy at the indicated time points after aSyn-GFP expression induction (***p<0.001; one way ANOVA with Bonferroni's multiple comparison test). (B) WT, S129A or S129E aSyn-GFP expression and pS129 levels in yeast cells assessed by western blot analysis of total protein extracts, at the indicated time points after aSyn-GFP expression induction (left panel). Densitometric analysis of the immunodetection of aSyn-GFP relative to the intensity obtained for GAPDH, used as loading control, presented in arbitrary units (a.u.) (right panel). Results shown are from one representative experiment from a total of three independent experiments. (C) The aggregated species formed in yeast cells by the WT and S129A aSyn-GFP were resolved using sucrose gradients after 6 hour of aSyn-GFP expression induction. The resulting fractions were separated on an SDS-page gel followed by immunoblotting with an antibody against aSyn (left panel). The same amount of WT and S129A aSyn-GFP protein was applied to the sucrose gradients, as confirmed by western blot (right panel). (D) The aggregated species formed by WT and S129A aSyn-GFP were also resolved using size exclusion-chromatography (SEC) after 6 hours of aSyn-GFP expression induction. Fractions were collected and separated on SDS-PAGE followed by western blot analyses with an antibody against aSyn or pS129 aSyn. The molecular weights indicated correspond to the calibration curve performed in the SEC, as shown in Figure S3. A representative result is shown from at least three independent experiments. Values represent the mean ± SD.
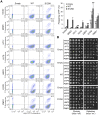
Figure 3. ER-to-Golgi trafficking genes are modifiers of S129A aSyn toxicity.
(A) aSyn-GFP versus Propidium Iodide (PI) fluorescence and Frequency of PI positive cells assessed by flow cytometry 6 hours after aSyn expression induction (§§§p<0.001 vs empty strain; *** p<0.001 vs WT; ###<0.001 or #p<0.05 vs S129A; one way ANOVA with Bonferroni's multiple comparison test). Results shown are from one representative experiment from three independent experiments. Values represent the mean ± SD. (B) Spotting assay of the indicated yeast cells. Cell suspensions were adjusted to the same OD600nm, serially diluted and spotted onto the surface of the solid medium containing either glucose (control) or galactose (induced aSyn expression) as carbon source. A representative result is shown from at least three independent experiments.
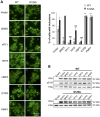
Figure 4. Modulation of ER-to-Golgi trafficking alters S129A aSyn inclusion formation.
(A) Intracellular localization of the WT or S129A aSyn-GFP (left panel) and percentage of yeast cells containing aSyn-GFP inclusions (right panel) in the indicated yeast strains, assessed by fluorescence microscopy after 6 hours of aSyn-GFP expression induction (*** p<0.001 vs WT; ###<0.001 vs S129A; one way ANOVA with Bonferroni's multiple comparison test). (B) WT or S129A aSyn-GFP expression and pS129 levels in the indicated yeast strains assessed by western blot analysis of total protein extracts 6 hours after aSyn-GFP expression induction. A representative result is shown from at least three independent experiments. Values represent the mean ± SD.
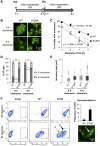
Figure 5. S129A aSyn inclusions clearance is compromised.
(A) Schematic representation of the treatments performed: aSyn expression was induced for 6 hours in galactose medium (Gal) and then yeast cells were transferred to glucose medium (Glu) to repress aSyn expression for 6 hours. (B) Intracellular localization of WT or S129A aSyn-GFP and (C) percentage of yeast cells containing aSyn-GFP inclusions, assessed by fluorescence microscopy at the indicated time points of aSyn clearance (***p<0.001, **p<0.01; two-tailed unpaired t-test with Welch's correction). (D) Percentage of cells presenting 3 or less inclusions, or 4 or more inclusions per cell (**p<0.01, *p<0.05; Unpaired two-tailed t-test), and (E) inclusions size (µm2) at 0 or 6 hours of aSyn clearance. (F) SSC (side scatter) and aSyn-GFP fluorescence in the indicated yeast cells, assessed by flow cytometry, at 0 and 6 hours after aSyn clearance. A sub-population of yeast cells presenting higher levels of GFP fluorescence is distinguishable after 6 hours of WT or S129A aSyn clearance (left panel). The frequency of cells of this sub-population is represented the in right upper panel. In the right lower panel a fluorescence microscopy picture exemplifies the different GFP intensities observed in aSyn yeast cells after 6 hours of clearance [(a) indicates cells with lower levels of GFP fluorescence and (b) sub-population of yeast cells presenting higher levels of GFP fluorescence]. A representative result is shown from at least three independent experiments. Values represent the mean ± SD.
Figure 6. The percentage of Triton-X insoluble S129A aSyn increases during clearance.
(A) WT and S129A aSyn-GFP protein levels in yeast cells assessed by western blot analysis of total protein extracts at the indicated time points of aSyn-GFP clearance (left panel). Densitometric analysis of the immunodetection of aSyn relative to the intensity obtained for GAPDH, used as loading control, presented in arbitrary units (a.u.) (right panel) (***p<0.001, *p<0.05; one way ANOVA with Bonferroni's multiple comparison test). (B) Triton-X soluble (TS) and Triton-X insoluble (TI) fractions of aSyn WT or S129A assessed by western blot analysis (upper panel) and determination by densitometric analysis of the percentage of TI aSyn, at the indicated time points of aSyn clearance (lower panel) (*p<0.05; Mann-Whitney test). GAPDH was used as an internal control for the experiment. A representative result is shown from at least four independent experiments. Values represent the mean ± SD.
Figure 7. Blocking aSyn phosphorylation reduces membrane interactions and accelerates inclusion formation.
(A) Time lapse confocal imaging comparing the distribution of WT or S129A aSyn-GFP at the indicated time points after induction of aSyn expression. Nuclei were visualized by co-expressing NLS-TagRFP657. (B) Percentage of WT and S129A aSyn-GFP expressing cells presenting inclusions over time. nwt = 48 cells, nS129A = 55 cells. Inclusions were recognized by measuring GFP intensity.
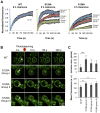
Figure 8. Inclusions formed by S129A aSyn-GFP are more heterogeneous than the ones formed by WT aSyn-GFP.
(A) FRAP recovery curves for WT and S129A aSyn-GFP inclusions on yeast cells expressing aSyn forms at the indicated time points. For each strain, at least 15 inclusions in different cells were analyzed. Each plot represents mean ± SD for each time point for all FRAP experiments (for the WT aSyn-GFP expressing cells) or groups of FRAP experiments organized by recovery profiles (for the S129A aSyn-GFP expressing cells). (B) FRAP time lapse recording of a representative inclusion of each group (C) Area (pixels) and fluorescence intensity mean (in arbitrary units, a.u.) of the inclusions analyzed (***p<0.001 and ** p<0.01; one way ANOVA with Bonferroni's multiple comparison test). A representative result is shown from at least three independent experiments. Values represent the mean ± SD.
Figure 9. Plasma membrane to vacuole endocytic trafficking of WT and S129A aSyn.
(A) aSyn inclusions localize to membrane and endosomal compartments. Cells coexpressing Jen1-mCherry and WT or S129A aSyn-GFP were grown at 30°C in glucose and shifted to galactose for 6 hours. Jen1-mCherry is constitutively synthesized, trafficked to the membrane, and re-absorbed through the endocytic pathway, eventually ending up in the vacuole. Since mCherry is pH stable it is visible in the vacuole. aSyn-GFP inclusions colocalize with Jen1-mCherry in endosome compartments throughout the entire endocytic pathway. (B) aSyn foci cluster with vesicles. Images shown are still frames from a time-lapse series showing internalization of aSyn through the endocytic pathway. In some cases of low level of aSyn aggregation enters the vacuole. As the aggregation level increases, however, aSyn-cotaining vesicles are trapped, likely in late endosomes. (C) aSyn inclusions are present as vesicles or vesicle clusters (arrows). Expression of S129A aSyn-GFP was induced for 8 hours. 3D reconstruction and single z sections (2D) are shown. Each z series was acquired with 0.4 micron step size and 21 total steps.
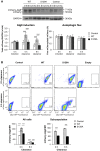
Figure 10. S129A aSyn impairs ATG8 induction.
(A) Autophagy evaluated by mCherry-Atg8 processing assay in yeast cells expressing mCherry-Atg8 under the regulation of the endogenous promoter alone (control) or together with either WT or S129A aSyn, at the indicated time points, assessed by western blot (upper panel) (hi:hours of induction; hc: hours of clearance). ATG8 induction quantified by the total mCherry signal (mCherry-Atg8 and free mCherry signal, detected with anti-mCherry) (lower left panel); autophagic flux quantified by measuring the vacuolar degradation of the Atg8 domain reporter (ratio of free mCherry to total mCherry signal) (lower right panel). (***p-value<0.001; one way ANOVA with Bonferroni's multiple comparison test). Results shown are from one representative experiment from a total of five independent experiments. (B) aSyn-GFP and mCherry-Atg8 fluorescence intensity in yeast cells expressing mCherry-Atg8 alone (control) or together with either WT or S129A aSyn, at the indicated time points, assessed by flow cytometry (upper panel). mCherry-Atg8 MFI from all cells (lower left panel) and from the indicated sub-population (lower right panel) (***p<0.001, one way ANOVA, with Bonferroni's multiple comparison test). Yeast cells not expressing aSyn-GFP or mCherry-Atg8 were also used as an additional control (empty). A representative result is shown from at least four independent experiments. Values represent the mean ± SD.
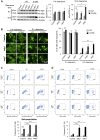
Figure 11. Impairment of autophagy decreases S129A aSyn-GFP clearance and increases toxicity.
(A) WT and S129A aSyn-GFP expression levels assessed by western blot analysis of total protein extracts at the indicated time points of aSyn-GFP clearance (left panel). Densitometric analysis of the immunodetection of aSyn relative to the intensity obtained for PGK used as loading control, presented in arbitrary units (a.u.) (right panel). (B) Intracellular localization of WT or S129A aSyn-GFP (left panel) and percentage of cells containing aSyn-GFP inclusions assessed by fluorescence microscopy at the indicated time points of aSyn clearance (right panel). (C) Side scatter (SSC) and aSyn-GFP fluorescence assessed by flow cytometry, at 6 hours of aSyn clearance (upper panel). The frequency of parent of the sub-population of yeast cells presenting higher levels of GFP fluorescence is represented in the lower panel. (D) SSC versus Propidium Iodide (PI) fluorescence and Frequency of PI positive cells assessed by flow cytometry after 6 hours of aSyn clearance. (***p<0.001; **p<0.01, *p<0.05; one way ANOVA with Bonferroni's multiple comparison test). A representative result is shown from at least four independent experiments. Values represent the mean ± SD.
Similar articles
- A novel multiplex assay for simultaneous quantification of total and S129 phosphorylated human alpha-synuclein.
Landeck N, Hall H, Ardah MT, Majbour NK, El-Agnaf OM, Halliday G, Kirik D. Landeck N, et al. Mol Neurodegener. 2016 Aug 22;11(1):61. doi: 10.1186/s13024-016-0125-0. Mol Neurodegener. 2016. PMID: 27549140 Free PMC article. - Implication of Alpha-Synuclein Phosphorylation at S129 in Synucleinopathies: What Have We Learned in the Last Decade?
Oueslati A. Oueslati A. J Parkinsons Dis. 2016;6(1):39-51. doi: 10.3233/JPD-160779. J Parkinsons Dis. 2016. PMID: 27003784 Free PMC article. Review. - C-Terminal Tyrosine Residue Modifications Modulate the Protective Phosphorylation of Serine 129 of α-Synuclein in a Yeast Model of Parkinson's Disease.
Kleinknecht A, Popova B, Lázaro DF, Pinho R, Valerius O, Outeiro TF, Braus GH. Kleinknecht A, et al. PLoS Genet. 2016 Jun 24;12(6):e1006098. doi: 10.1371/journal.pgen.1006098. eCollection 2016 Jun. PLoS Genet. 2016. PMID: 27341336 Free PMC article. - Systematic comparison of the effects of alpha-synuclein mutations on its oligomerization and aggregation.
Lázaro DF, Rodrigues EF, Langohr R, Shahpasandzadeh H, Ribeiro T, Guerreiro P, Gerhardt E, Kröhnert K, Klucken J, Pereira MD, Popova B, Kruse N, Mollenhauer B, Rizzoli SO, Braus GH, Danzer KM, Outeiro TF. Lázaro DF, et al. PLoS Genet. 2014 Nov 13;10(11):e1004741. doi: 10.1371/journal.pgen.1004741. eCollection 2014 Nov. PLoS Genet. 2014. PMID: 25393002 Free PMC article. - Do Lewy bodies contain alpha-synuclein fibrils? and Does it matter? A brief history and critical analysis of recent reports.
Lashuel HA. Lashuel HA. Neurobiol Dis. 2020 Jul;141:104876. doi: 10.1016/j.nbd.2020.104876. Epub 2020 Apr 25. Neurobiol Dis. 2020. PMID: 32339655 Review.
Cited by
- (Poly)phenol-digested metabolites modulate alpha-synuclein toxicity by regulating proteostasis.
Macedo D, Jardim C, Figueira I, Almeida AF, McDougall GJ, Stewart D, Yuste JE, Tomás-Barberán FA, Tenreiro S, Outeiro TF, Santos CN. Macedo D, et al. Sci Rep. 2018 May 3;8(1):6965. doi: 10.1038/s41598-018-25118-z. Sci Rep. 2018. PMID: 29725038 Free PMC article. - A Longitudinal Study of Total and Phosphorylated α-Synuclein with Other Biomarkers in Cerebrospinal Fluid of Alzheimer's Disease and Mild Cognitive Impairment.
Wang H, Stewart T, Toledo JB, Ginghina C, Tang L, Atik A, Aro P, Shaw LM, Trojanowski JQ, Galasko DR, Edland S, Jensen PH, Shi M, Zhang J; Alzheimer’s Disease Neuroimaging Initiative. Wang H, et al. J Alzheimers Dis. 2018;61(4):1541-1553. doi: 10.3233/JAD-171013. J Alzheimers Dis. 2018. PMID: 29376878 Free PMC article. - Small Molecule Fisetin Modulates Alpha-Synuclein Aggregation.
Rosado-Ramos R, Godinho-Pereira J, Marques D, Figueira I, Fleming Outeiro T, Menezes R, Nunes Dos Santos C. Rosado-Ramos R, et al. Molecules. 2021 Jun 2;26(11):3353. doi: 10.3390/molecules26113353. Molecules. 2021. PMID: 34199487 Free PMC article. - α-Synuclein phosphorylation at serine 129 occurs after initial protein deposition and inhibits seeded fibril formation and toxicity.
Ghanem SS, Majbour NK, Vaikath NN, Ardah MT, Erskine D, Jensen NM, Fayyad M, Sudhakaran IP, Vasili E, Melachroinou K, Abdi IY, Poggiolini I, Santos P, Dorn A, Carloni P, Vekrellis K, Attems J, McKeith I, Outeiro TF, Jensen PH, El-Agnaf OMA. Ghanem SS, et al. Proc Natl Acad Sci U S A. 2022 Apr 12;119(15):e2109617119. doi: 10.1073/pnas.2109617119. Epub 2022 Mar 30. Proc Natl Acad Sci U S A. 2022. PMID: 35353605 Free PMC article. - Accumulation of α-synuclein mediates podocyte injury in Fabry nephropathy.
Braun F, Abed A, Sellung D, Rogg M, Woidy M, Eikrem O, Wanner N, Gambardella J, Laufer SD, Haas F, Wong MN, Dumoulin B, Rischke P, Mühlig A, Sachs W, von Cossel K, Schulz K, Muschol N, Gersting SW, Muntau AC, Kretz O, Hahn O, Rinschen MM, Mauer M, Bork T, Grahammer F, Liang W, Eierhoff T, Römer W, Hansen A, Meyer-Schwesinger C, Iaccarino G, Tøndel C, Marti HP, Najafian B, Puelles VG, Schell C, Huber TB. Braun F, et al. J Clin Invest. 2023 Jun 1;133(11):e157782. doi: 10.1172/JCI157782. J Clin Invest. 2023. PMID: 37014703 Free PMC article.
References
- Malinovska L, Kroschwald S, Alberti S (2013) Protein disorder, prion propensities, and self-organizing macromolecular collectives. Biochim Biophys Acta 1834: 918–931. - PubMed
- Spillantini MG, Crowther RA, Jakes R, Cairns NJ, Lantos PL, et al. (1998) Filamentous alpha-synuclein inclusions link multiple system atrophy with Parkinson's disease and dementia with Lewy bodies. Neurosci Lett 251: 205–208. - PubMed
- Spillantini MG, Schmidt ML, Lee VM, Trojanowski JQ, Jakes R, et al. (1997) Alpha-synuclein in Lewy bodies. Nature 388: 839–840. - PubMed
- Klein C, Lohmann-Hedrich K (2007) Impact of recent genetic findings in Parkinson's disease. Curr Opin Neurol 20: 453–464. - PubMed
Publication types
MeSH terms
Substances
LinkOut - more resources
Full Text Sources
Other Literature Sources
Medical
Molecular Biology Databases
Research Materials
Miscellaneous

