The H50Q mutation enhances α-synuclein aggregation, secretion, and toxicity - PubMed (original) (raw)
. 2014 Aug 8;289(32):21856-76.
doi: 10.1074/jbc.M114.553297. Epub 2014 Jun 16.
Bruno Fauvet 1, Abid Oueslati 1, Igor Dikiy 2, Anne-Laure Mahul-Mellier 1, Francesco Simone Ruggeri 3, Martial K Mbefo 1, Filip Vercruysse 1, Giovanni Dietler 3, Seung-Jae Lee 4, David Eliezer 2, Hilal A Lashuel 5
Affiliations
- PMID: 24936070
- PMCID: PMC4139205
- DOI: 10.1074/jbc.M114.553297
The H50Q mutation enhances α-synuclein aggregation, secretion, and toxicity
Ossama Khalaf et al. J Biol Chem. 2014.
Abstract
Over the last two decades, the identification of missense mutations in the α-synuclein (α-Syn) gene SNCA in families with inherited Parkinson disease (PD) has reinforced the central role of α-Syn in PD pathogenesis. Recently, a new missense mutation (H50Q) in α-Syn was described in patients with a familial form of PD and dementia. Here we investigated the effects of this novel mutation on the biophysical properties of α-Syn and the consequences for its cellular function. We found that the H50Q mutation affected neither the structure of free or membrane-bound α-Syn monomer, its interaction with metals, nor its capacity to be phosphorylated in vitro. However, compared with the wild-type (WT) protein, the H50Q mutation accelerated α-Syn fibrillization in vitro. In cell-based models, H50Q mutation did not affect α-Syn subcellular localization or its ability to be phosphorylated by PLK2 and GRK6. Interestingly, H50Q increased α-Syn secretion from SHSY5Y cells into culture medium and induced more mitochondrial fragmentation in hippocampal neurons. Although the transient overexpression of WT or H50Q did not induce toxicity, both species induced significant cell death when added to the culture medium of hippocampal neurons. Strikingly, H50Q exhibited more toxicity, suggesting that the H50Q-related enhancement of α-Syn aggregation and secretion may play a role in the extracellular toxicity of this mutant. Together, our results provide novel insight into the mechanism by which this newly described PD-associated mutation may contribute to the pathogenesis of PD and related disorders.
Keywords: Amyloid; Membrane; Metal Ion-Protein Interaction; Mitochondria; Mitochondrial Dysfunction; Mutation; Protein Aggregation; α-Synuclein.
© 2014 by The American Society for Biochemistry and Molecular Biology, Inc.
Figures
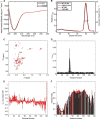
FIGURE 1.
Biophysical characterization of recombinant WT and H50Q α-Syn. A, CD spectra of recombinant WT (black) and H50Q (red) α-Syn in phosphate buffer. B, gel filtration chromatography with online multiangle static laser light scattering analysis of recombinant WT (black) and H50Q (red) α-Syn. C, 1H/15N HSQC spectra of α-Syn WT (black) andH50Q (red) in aqueous buffer. D, plot of averaged amide chemical shift difference (Δδavg = √(½(ΔδHN2 + (ΔδN/5)2) between the free state H50Q and WT spectra by residue number. The line shows a 3-residue average. E, plot of α-carbon secondary shifts (difference between measured chemical shift and random coil chemical shift) for α-Syn WT (black) and H50Q (red) in aqueous buffer by residue number. The lines show 3-residue averages. F, plot of the ratio of amide cross-peak intensity in paramagnetically labeled samples to the intensity in diamagnetic samples of E20C α-Syn (black) and E20C/H50Q α-Syn (red). The lines show 5-residue averages. deg, degrees; Abs, absorbance.
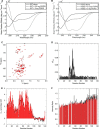
FIGURE 2.
In vitro membrane binding analyses. A, CD spectra of recombinant WT α-Syn with increasing concentrations of 100-nm-diameter POPG vesicles. B, CD spectra of recombinant H50Q α-Syn with increasing concentrations of 100-nm-diameter POPG vesicles. C, 1H/15N HSQC spectra of WT α-Syn (black) and H50Q (red) in the presence of 40 m
m
SDS. D, plot of averaged amide chemical shift difference (Δδavg = √(½(ΔδHN2 + (ΔδN/5)2) between the SDS H50Q and WT spectra by residue number. The line shows a 3-residue average. E, plot of α-carbon secondary shifts (difference between measured chemical shift and random coil chemical shift) for α-Syn WT (black) and H50Q (red) in 40 m
m
SDS by residue number. The lines show 3-residue averages. F, ratio of amide cross-peak intensities in samples with 3 m
m
SUVs to the intensity in samples without SUVs for WT α-Syn (black) and H50Q (red) by residue number. deg, degrees.
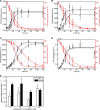
FIGURE 3.
Comparison of WT and H50Q α-Syn fibrillization properties. A, ThT and sedimentation analyses of WT and H50Q α-Syn at a starting concentration of 5 μ
m
. B, C, and D, the same experiments as in A were performed with initial protein concentrations of 10, 20, and 45 μ
m
, respectively. In A–D, black curves correspond to ThT fluorescence kinetics (left ordinate axes), and red curves correspond to quantification of soluble protein content by sedimentation analysis (right ordinate axes). Dashed lines indicate WT α-Syn, and solid lines indicate H50Q α-Syn. Each curve is a representative specimen from at least three independent experiments. E, quantification of apparent fibril growth rates based on ThT fluorescence curves. Error bars represent mean ± S.E. A.U., absorbance units.
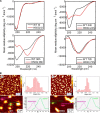
FIGURE 4.
Effect of the H50Q mutation on α-Syn misfolding and oligomerization. A, CD spectra of WT (black) and H50Q (red) α-Syn taken at different time points of an aggregation experiment done at a starting protein concentration of 20 μ
m
. For CD analysis, samples were diluted to 10 μ
m
with water and analyzed in a 1-mm-optical path cell. B, AFM analysis of freshly prepared α-Syn samples at a low concentration of deposition. Panel a, analysis of freshly prepared WT α-Syn deposited at 0.5 μ
m
on bare mica. Top left panel, high resolution height map (scale bar, 100 nm); bottom left panel, zoomed section of the above picture showing typical monomer and dimer particles (scale bar, 10 nm); top right panel, height distribution histogram; bottom right panel, cross-sectional analysis of WT α-Syn monomer (magenta line) and dimer (green line) particles from the bottom left picture. Panel b, the same analyses were performed on freshly prepared H50Q α-Syn samples. Top left panel, high resolution height map (scale bar, 100 nm); bottom left panel, zoomed section of the above picture showing typical monomer and dimer particles (scale bar, 10 nm); top right panel, height distribution histogram; bottom right panel, cross-sectional analysis of H50Q α-Syn monomer (magenta line) and dimer (green line) particles from the bottom left picture. deg, degrees.
FIGURE 5.
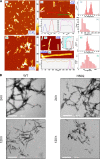
Analysis of WT and H50Q α-Syn amyloid fibrils. A, AFM analysis of the morphology of fibrillar structures of H50Q (panels a–d) and WT α-Syn (panels e–i) after 6 days of incubation deposited at high concentration (45 μ
m
) on APTES-functionalized mica. Panel a, overview of H50Q α-Syn fibrillar aggregates. Panel b, details of H50Q protofibrils and fibrils with measurement of their cross-sectional dimensions and comparison with oligomer height. Panels c and d, distribution of the average height and length of H50Q fibrillar structures. Panel e, overview of WT α-Syn fibrillar aggregates. Panel f, details of WT protofibrils and fibrils and their cross-sectional dimensions. Panel g, high resolution scan of a WT protofibril and measurement of its cross-sectional dimensions. Panels h and i, distribution of the average height and length of WT fibrillar structures. B, transmission electron microscopy analysis of negatively stained samples of WT and H50Q α-Syn taken after 24 (top) or 120 h (bottom) of agitation at 37 °C. Scale bars, 200 nm. Av., average.
FIGURE 6.
1H/15N HSQC NMR-based measurements of the effect of the H50Q mutation on metal binding. A, plot of the ratio of cross-peak intensities in H50Q α-Syn samples containing 1:1 Cu(II):protein (green), 2:1 Cu(II):protein (red), and previously measured WT α-Syn samples containing 2:1 Cu(II):protein (black) (18) to the intensities in copper-free samples by residue number. B, plot of the intensity ratios for H50Q α-Syn containing 2:1 Cu(II):protein (red) compared with previously measured intensity ratios for H50A α-Syn containing 2:1 Cu(II):protein (blue) (17). C, plot of averaged amide chemical shift difference (Δδavg = √(1/2(ΔδHN2 + (ΔδN/5)2) upon the addition of 1 m
m
Fe(III) (∼10:1 Fe(III):protein) by residue number for both H50Q (red) and WT (black) α-Syn. D, plot of averaged amide chemical shift difference (Δδavg = √(1/2(ΔδHN2 + (ΔδN/5)2) upon the addition of 1 m
m
Zn(II) (∼10:1 Zn(II):protein) by residue number for both H50Q (red) and WT (black) α-Syn.
FIGURE 7.
In vitro phosphorylation of WT and H50Q α-Syn by PLK2, CK1, and SYK. A, MALDI-TOF-MS analysis of the phosphorylation reaction after 17-h incubation with PLK3, CK1, and SYK. The analysis demonstrated that WT and H50Q α-Syn are quantitatively phosphorylated at Ser-129 after incubation with PLK3. Double (Ser-87 and Ser-129) and triple phosphorylations (Tyr-39, Tyr-125, and Tyr-133) were observed after α-Syn incubation with CK1 and SYK, respectively. B–D, immunoblots of Ser(P)-129, Ser(P)-87, Tyr(P)-39, Tyr(P)-125, and Tyr(P)-133 α-Syn phosphorylated by PLK3, CK1, and SYK.
FIGURE 8.
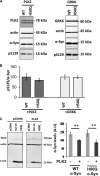
Cell-based phosphorylation and degradation of α-Syn. A, PLK2- and GRK6-mediated phosphorylation in cell culture. HEK cells were transfected with 3 μg of plasmid DNA for α-Syn and 1 μg of PLK2 or GRK6 and collected 24 h post-transfection. B, Ser(P)-129/α-Syn ratio shows that WT and H50Q α-Syn exhibit the same extent of phosphorylation. C, WT and H50Q α-Syn are both degraded after PLK2 overexpression. Western blotting and optical density quantification revealed that PLK2 overexpression induces a significant decrease of WT and H50Q α-Syn signal. Error bars represent means ± S.D. An ANOVA test followed by a Tukey-Kramer post hoc test was performed. **, p < 0.01 (presence versus absence of the kinase). A.U., absorbance units.
FIGURE 9.
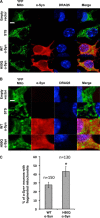
The H50Q mutation does not affect α-Syn subcellular localization. Immunocytochemistry in mouse hippocampal primary neurons (A) and mammalian HeLa cells (B) shows that WT α-Syn and the H50Q mutant exhibit similar cytoplasmic and membranous subcellular localization. Biochemical subcellular fractionation showed that the two forms of α-Syn (WT and H50Q) are enriched in the cytosolic and membrane fractions (C), and the optical density analysis (D) (n = 3) confirmed similar levels of the different α-Syn forms in the cytosolic (black columns) and membrane (hatched columns) fractions. The purity of the fractions was further validated by assessing the expression level of housekeeping proteins specific for each fraction (PARP1a for the cytosolic fraction, GRP78 for the membrane fraction, and HSP90 and histone H1 for nuclear fractions). Error bars represent mean ± S.D. Scale bars correspond to 10 μm.
FIGURE 10.
The H50Q mutation enhances the secretion of α-Syn and α-Syn aggregation in differentiated SHSY5Y cells. A, differentiated SHSY5Y cells overexpressing WT α-Syn or H50Q were subfractionated into Triton X-100-soluble (TX-Sol) and -insoluble (TX inSol) fractions. Both fractions as well as CM derived from these cells were analyzed by Western blotting. Similar α-Syn expression levels were obtained in Triton X-100- (left panel) and Triton-insoluble fractions (middle panel). The H50Q mutant in contrast showed elevated monomers and higher molecular weight (HMW) aggregates in the CM (right panel). β-Actin was used to assess the amount of total proteins loaded (bottom panel). B, densitometric analysis of α-Syn monomers released into CM normalized to α-Syn in the Triton X-100-soluble fraction. C, sandwich ELISA of total α-Syn in CM showing a significant increase of H50Q compared with WT (t test; *, p < 0.05). D, lactate dehydrogenase (LDH) assay showing no significant difference between the cytotoxicity of WT and H50Q. Error bars represent mean ± S.D.
FIGURE 11.
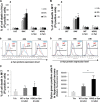
The H50Q mutation exacerbates neuronal toxicity of extracellular α-Syn. A and B, WT α-Syn or its mutant H50Q does not induce cell death when ectopically expressed in mammalian cell lines. HeLa (A) and M17 cells (B) were transfected with a negative control plasmid coding for luciferase (LUC), a positive control plasmid coding for BAX, or a plasmid encoding WT α-Syn or its mutant H50Q. HeLa (A, panel a) and M17 cells (B, panel a) were then harvested 24, 48, or 72 h post-transfection and stained with PI, a vital dye, to score cell death; cells permeable to PI were counted as dead by FACS analysis. Shown are the means of three independent experiments done in triplicate for each construct in HeLa cells (A, panel a) and in M17 cells (B, panel a). An ANOVA test followed by a Tukey-Kramer post hoc test was performed. **, p < 0.005 (luciferase versus BAX). The relative expressions levels of WT and H50Q α-Syn after overexpression were evaluated by FACS analysis in HeLa (A, panel b) and M17 cell lines (B, panel b). C and D, extracellular WT α-Syn and H50Q crude preparations induce cell death in M17 mammalian cells and primary hippocampal neurons. C, M17 cells were treated for 4 days with Tris (negative control) or with a crude preparation of α-Syn recombinant protein (WT or H50Q) containing a mixture of monomers, oligomers, and protofibrils at a final concentration of 10 μ
m
. The cells were then harvested and stained with the vital dye PI. Cell death was scored on the basis of cell population permeable to PI as measured by FACS analysis. Shown is a representative histogram of three independent experiments done in triplicate for each condition (n = 3). *, p < 0.01. An ANOVA test followed by a Tukey-Kramer post hoc test was performed (Tris versus crude α-Syn WT or H50Q). D, primary hippocampal neurons were treated for 6 days with a crude preparation of α-Syn recombinant protein (WT or H50Q) at a final concentration of 10 μ
m
. Cell death was scored on the basis of cell population permeable to the vital dye SYTOX Green as measured by total fluorescence assessed by fluorescence plate reading. Shown is a representative histogram of three independent experiments done in triplicate for each condition (n = 3). An ANOVA test followed by a Tukey-Kramer post hoc test was performed. **, p < 0.005 (crude WT versus crude H50Q); ***, p < 0.00001 (Tris versus crude α-Syn WT or H50Q). Error bars in A–D represent means ± S.D.
FIGURE 12.
Effect of the H50Q mutation on mitochondrial morphology. A and B, low and high magnification confocal images illustrating the effect of α-Syn overexpression on the mitochondrial morphology in hippocampal primary culture. Overexpression of WT and H50Q α-Syn along with YFP-mito in primary mouse hippocampal neurons shows enhanced mitochondrial fragmentation. As a positive control, treatment with staurosporine (STS) (1 μ
m
) for 2 h induced an increase in the number of neurons that displayed mitochondrial fragmentation. DRAQ5® is a cell-permeable far-red fluorescent DNA dye used to stain the nuclei. Scale bars, 5 μm (A) and 2 μm (B). C, quantification of the α-Syn-positive neurons showing fragmented mitochondria demonstrated that H50Q α-Syn overexpression induced more cells exhibiting mitochondrial fragmentation (n = 3). Error bars represent means ± S.D. An ANOVA test followed by a Tukey-Kramer post hoc test was performed. *, p < 0.005 (H50Q versus WT α-Syn).
Similar articles
- The novel Parkinson's disease linked mutation G51D attenuates in vitro aggregation and membrane binding of α-synuclein, and enhances its secretion and nuclear localization in cells.
Fares MB, Ait-Bouziad N, Dikiy I, Mbefo MK, Jovičić A, Kiely A, Holton JL, Lee SJ, Gitler AD, Eliezer D, Lashuel HA. Fares MB, et al. Hum Mol Genet. 2014 Sep 1;23(17):4491-509. doi: 10.1093/hmg/ddu165. Epub 2014 Apr 11. Hum Mol Genet. 2014. PMID: 24728187 Free PMC article. - Divergent effects of the H50Q and G51D SNCA mutations on the aggregation of α-synuclein.
Rutherford NJ, Moore BD, Golde TE, Giasson BI. Rutherford NJ, et al. J Neurochem. 2014 Dec;131(6):859-67. doi: 10.1111/jnc.12806. Epub 2014 Jul 21. J Neurochem. 2014. PMID: 24984882 - The Parkinson's disease-associated H50Q mutation accelerates α-Synuclein aggregation in vitro.
Ghosh D, Mondal M, Mohite GM, Singh PK, Ranjan P, Anoop A, Ghosh S, Jha NN, Kumar A, Maji SK. Ghosh D, et al. Biochemistry. 2013 Oct 8;52(40):6925-7. doi: 10.1021/bi400999d. Epub 2013 Sep 23. Biochemistry. 2013. PMID: 24047453 - Alteration of Structure and Aggregation of α-Synuclein by Familial Parkinson's Disease Associated Mutations.
Sahay S, Ghosh D, Singh PK, Maji SK. Sahay S, et al. Curr Protein Pept Sci. 2017;18(7):656-676. doi: 10.2174/1389203717666160314151706. Curr Protein Pept Sci. 2017. PMID: 26972727 Review. - α-Synuclein misfolding and aggregation: Implications in Parkinson's disease pathogenesis.
Mehra S, Sahay S, Maji SK. Mehra S, et al. Biochim Biophys Acta Proteins Proteom. 2019 Oct;1867(10):890-908. doi: 10.1016/j.bbapap.2019.03.001. Epub 2019 Mar 7. Biochim Biophys Acta Proteins Proteom. 2019. PMID: 30853581 Review.
Cited by
- Monitoring alpha-synuclein oligomerization and aggregation using bimolecular fluorescence complementation assays: What you see is not always what you get.
Frey B, AlOkda A, Jackson MP, Riguet N, Duce JA, Lashuel HA. Frey B, et al. J Neurochem. 2021 May;157(4):872-888. doi: 10.1111/jnc.15147. Epub 2020 Oct 27. J Neurochem. 2021. PMID: 32772367 Free PMC article. - Subcellular localization of alpha-synuclein aggregates and their interaction with membranes.
Miraglia F, Ricci A, Rota L, Colla E. Miraglia F, et al. Neural Regen Res. 2018 Jul;13(7):1136-1144. doi: 10.4103/1673-5374.235013. Neural Regen Res. 2018. PMID: 30028312 Free PMC article. Review. - Targeting α-Synuclein in Parkinson's Disease by Induced Pluripotent Stem Cell Models.
Spathopoulou A, Edenhofer F, Fellner L. Spathopoulou A, et al. Front Neurol. 2022 Jan 25;12:786835. doi: 10.3389/fneur.2021.786835. eCollection 2021. Front Neurol. 2022. PMID: 35145469 Free PMC article. Review. - Quality Over Quantity: Advantages of Using Alpha-Synuclein Preformed Fibril Triggered Synucleinopathy to Model Idiopathic Parkinson's Disease.
Duffy MF, Collier TJ, Patterson JR, Kemp CJ, Fischer DL, Stoll AC, Sortwell CE. Duffy MF, et al. Front Neurosci. 2018 Sep 4;12:621. doi: 10.3389/fnins.2018.00621. eCollection 2018. Front Neurosci. 2018. PMID: 30233303 Free PMC article. - The Pathological G51D Mutation in Alpha-Synuclein Oligomers Confers Distinct Structural Attributes and Cellular Toxicity.
Xu CK, Castellana-Cruz M, Chen SW, Du Z, Meisl G, Levin A, Mannini B, Itzhaki LS, Knowles TPJ, Dobson CM, Cremades N, Kumita JR. Xu CK, et al. Molecules. 2022 Feb 15;27(4):1293. doi: 10.3390/molecules27041293. Molecules. 2022. PMID: 35209093 Free PMC article.
References
- Spillantini M. G., Schmidt M. L., Lee V. M., Trojanowski J. Q., Jakes R., Goedert M. (1997) α-Synuclein in Lewy bodies. Nature 388, 839–840 - PubMed
- Polymeropoulos M. H., Lavedan C., Leroy E., Ide S. E., Dehejia A., Dutra A., Pike B., Root H., Rubenstein J., Boyer R., Stenroos E. S., Chandrasekharappa S., Athanassiadou A., Papapetropoulos T., Johnson W. G., Lazzarini A. M., Duvoisin R. C., Di Iorio G., Golbe L. I., Nussbaum R. L. (1997) Mutation in the α-synuclein gene identified in families with Parkinson's disease. Science 276, 2045–2047 - PubMed
Publication types
MeSH terms
Substances
Grants and funding
- CO6RR015495/CO/NCI NIH HHS/United States
- R37 AG019391/AG/NIA NIH HHS/United States
- P41GM066354/GM/NIGMS NIH HHS/United States
- R37AG019391/AG/NIA NIH HHS/United States
- C06 RR015495/RR/NCRR NIH HHS/United States
- P41 GM066354/GM/NIGMS NIH HHS/United States
LinkOut - more resources
Full Text Sources
Other Literature Sources
Molecular Biology Databases
Miscellaneous
