Strength of selection pressure is an important parameter contributing to the complexity of antibiotic resistance evolution - PubMed (original) (raw)
Strength of selection pressure is an important parameter contributing to the complexity of antibiotic resistance evolution
Tugce Oz et al. Mol Biol Evol. 2014 Sep.
Abstract
Revealing the genetic changes responsible for antibiotic resistance can be critical for developing novel antibiotic therapies. However, systematic studies correlating genotype to phenotype in the context of antibiotic resistance have been missing. In order to fill in this gap, we evolved 88 isogenic Escherichia coli populations against 22 antibiotics for 3 weeks. For every drug, two populations were evolved under strong selection and two populations were evolved under mild selection. By quantifying evolved populations' resistances against all 22 drugs, we constructed two separate cross-resistance networks for strongly and mildly selected populations. Subsequently, we sequenced representative colonies isolated from evolved populations for revealing the genetic basis for novel phenotypes. Bacterial populations that evolved resistance against antibiotics under strong selection acquired high levels of cross-resistance against several antibiotics, whereas other bacterial populations evolved under milder selection acquired relatively weaker cross-resistance. In addition, we found that strongly selected strains against aminoglycosides became more susceptible to five other drug classes compared with their wild-type ancestor as a result of a point mutation on TrkH, an ion transporter protein. Our findings suggest that selection strength is an important parameter contributing to the complexity of antibiotic resistance problem and use of high doses of antibiotics to clear infections has the potential to promote increase of cross-resistance in clinics.
Keywords: antibiotic resistance; antibiotic susceptibility; cross-resistance; evolution; genotyping; whole-genome sequencing.
© The Author 2014. Published by Oxford University Press on behalf of the Society for Molecular Biology and Evolution.
Figures
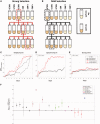
Fig. 1.
Bacteria develop high antibiotic resistance under both strong and mild selection at the end of 21 days. (A) Schematic illustration of bacterial evolution experiments in liquid culture under strong selection. Bacterial populations were grown in several tubes with increased drug concentrations that span the expected MIC of the population. Populations were grown for approximately 22 h and the populations surviving in the highest drug concentration were transferred to new culture vials (yielding 60× dilution, 6–7 generations per day if new mutants do not appear) with increasing drug concentrations. (B) Schematic illustration of bacterial evolution experiments in liquid culture under mild selection. (C–E) Resistance levels (MIC) recorded on a daily basis for parallel populations evolving under strong selection (red triangle and red circle) and mild selection (black triangle and black circle) against streptomycin (C), spectinomycin (D), and doxycycline (E). See
supplementary table S1
,
Supplementary Material
online, for daily-recorded MIC values for all evolved populations. (F) For every drug used in evolution experiments, average final resistance and standard deviation were calculated for the two populations evolving in parallel under strong selection and two populations evolving in parallel under mild selection. Logarithm of the ratios between final resistance of strongly selected strains and mildly selected strains are shown with colored circles. Mean value for this ratio is 0.47 ± 0.65 (mean ± standard deviation).
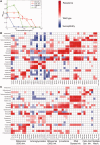
Fig. 2.
Cross-resistance measurements of drug-resistant strains. (A) Representative strains selected from evolved populations were grown for approximately 22 h in duplicates in increasing drug concentrations and mean value of final OD reads was used to plot dose–response curves. MIC values were calculated by interpolating the drug concentrations corresponding to ODfinal reads at 0.03. Chloramphenicol resistance of wild-type ancestor strain (green circles), a strain evolved against doxycycline (DOX-S-2, orange triangles), a strain evolved against chloramphenicol (CHL-S-2, red circles), and a strain against kanamycin (TOB-S-2, blue circles) were measured. (B) Cross-resistance measurements of strains evolved under strong selection and (C) mild selection. For every drug, we measured each strain’s MIC and used the maximum direct-resistance (resistance evolved against the drug used for selection) we measured against that drug for normalization. We color scale every measurement after calculating a metric for cross-resistance using the following formula: MICnormalized = (log10 [MICmeasured/MICWT]/log10 [MICmax/MICWT]). Cross-resistance measurements are shown in red for increased resistance and in blue for increased susceptibility with darker colors indicating stronger phenotypic changes. Increased resistance and susceptibilities less than 90% of the dilution factor of cross-resistance measurements are shown in white. See
supplementary table S2
,
Supplementary Material
online, for numerical values for MIC measurements.
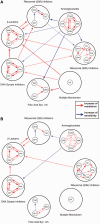
Fig. 3.
Cross-resistance networks for strains evolved (A) under strong selection and (B) mild selection (Materials and Methods and
supplementary fig. S2
,
Supplementary Material
online). If a strain evolved in the presence of drug A developed resistance against drug B, a red line originating from drug A was drawn toward drug B with an arrow pointing drug B. Lines are colored in blue if increased susceptibility is observed and there are no lines when there is no detectable phenotypic change. Thicknesses of these lines represent the frequency of cross-resistance or antibiotic susceptibility, and darker colors indicate stronger phenotypic changes. All cross-resistance within drug classes are separately shown, however, only average cross-resistance and antibiotic susceptibility changes were shown (if existed) between drug classes for clarity.
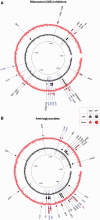
Fig. 4.
Mutations found in strains evolved against a drug class under strong selection (outer red circle) and mild selection (inner black circle) are shown with filled red and black markers, respectively. SNPs are shown with filled circles and indels are shown with filled triangles. Mutated genes’ names are printed using standard annotations; however, mutations are printed as “unknown” if there are no annotated genes found in literature (
supplementary table S3
,
Supplementary Material
online). Pathway-specific mutations are printed in blue. (A) Mutations found in strains evolved against 50S ribosomal inhibitors. (B) Mutations found in strains evolved against aminoglycosides. The TrkH gene, which is mutated in five aminoglycoside-resistant strains, is shown with a magenta arrow.
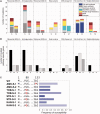
Fig. 5.
(A) Diverse genetic changes found in antibiotic-resistant strains. For every drug class, numbers of mutations belonging to major cellular pathways are shown with different colors. These changes are grouped for strongly (S) selected strains and mildly (M) selected strains. (B) Number of mutated pathway-specific genes per drug class for strongly (S) selected strains, mildly (M) selected strains, and found to be common (C) in both strongly selected and mildly selected strains. (C) TrkH mutations and drug susceptibility of aminoglycoside-resistant strains. Color weight of the bars in the histogram indicates the strength of antibiotic susceptibility of strongly selected aminoglycoside-resistant strains.
Similar articles
- Bacterial evolution of antibiotic hypersensitivity.
Lázár V, Pal Singh G, Spohn R, Nagy I, Horváth B, Hrtyan M, Busa-Fekete R, Bogos B, Méhi O, Csörgő B, Pósfai G, Fekete G, Szappanos B, Kégl B, Papp B, Pál C. Lázár V, et al. Mol Syst Biol. 2013 Oct 29;9:700. doi: 10.1038/msb.2013.57. Mol Syst Biol. 2013. PMID: 24169403 Free PMC article. - Associations among Antibiotic and Phage Resistance Phenotypes in Natural and Clinical Escherichia coli Isolates.
Allen RC, Pfrunder-Cardozo KR, Meinel D, Egli A, Hall AR. Allen RC, et al. mBio. 2017 Oct 31;8(5):e01341-17. doi: 10.1128/mBio.01341-17. mBio. 2017. PMID: 29089428 Free PMC article. - Genomics of rapid adaptation to antibiotics: convergent evolution and scalable sequence amplification.
Laehnemann D, Peña-Miller R, Rosenstiel P, Beardmore R, Jansen G, Schulenburg H. Laehnemann D, et al. Genome Biol Evol. 2014 May 20;6(6):1287-301. doi: 10.1093/gbe/evu106. Genome Biol Evol. 2014. PMID: 24850796 Free PMC article. - [Analysis of Drug Resistance Using Experimental Evolution].
Furusawa C. Furusawa C. Yakugaku Zasshi. 2017;137(4):373-376. doi: 10.1248/yakushi.16-00235-1. Yakugaku Zasshi. 2017. PMID: 28381708 Review. Japanese. - Allogenous Selection of Mutational Collateral Resistance: Old Drugs Select for New Resistance Within Antibiotic Families.
Baquero F, Martínez JL, Novais Â, Rodríguez-Beltrán J, Martínez-García L, Coque TM, Galán JC. Baquero F, et al. Front Microbiol. 2021 Oct 22;12:757833. doi: 10.3389/fmicb.2021.757833. eCollection 2021. Front Microbiol. 2021. PMID: 34745065 Free PMC article. Review.
Cited by
- Tackling Drug Resistant Infection Outbreaks of Global Pandemic Escherichia coli ST131 Using Evolutionary and Epidemiological Genomics.
Downing T. Downing T. Microorganisms. 2015 May 20;3(2):236-67. doi: 10.3390/microorganisms3020236. Microorganisms. 2015. PMID: 27682088 Free PMC article. Review. - Macrophage adaptation leads to parallel evolution of genetically diverse Escherichia coli small-colony variants with increased fitness in vivo and antibiotic collateral sensitivity.
Ramiro RS, Costa H, Gordo I. Ramiro RS, et al. Evol Appl. 2016 Jun 30;9(8):994-1004. doi: 10.1111/eva.12397. eCollection 2016 Sep. Evol Appl. 2016. PMID: 27606007 Free PMC article. - Low protein expression enhances phenotypic evolvability by intensifying selection on folding stability.
Karve S, Dasmeh P, Zheng J, Wagner A. Karve S, et al. Nat Ecol Evol. 2022 Aug;6(8):1155-1164. doi: 10.1038/s41559-022-01797-w. Epub 2022 Jul 7. Nat Ecol Evol. 2022. PMID: 35798838 Free PMC article. - Revisiting Antibiotic Resistance: Mechanistic Foundations to Evolutionary Outlook.
Hasan CM, Dutta D, Nguyen ANT. Hasan CM, et al. Antibiotics (Basel). 2021 Dec 30;11(1):40. doi: 10.3390/antibiotics11010040. Antibiotics (Basel). 2021. PMID: 35052917 Free PMC article. Review. - The population genetics of collateral resistance and sensitivity.
Ardell SM, Kryazhimskiy S. Ardell SM, et al. Elife. 2021 Dec 10;10:e73250. doi: 10.7554/eLife.73250. Elife. 2021. PMID: 34889185 Free PMC article.
References
- Alekshun MN, Levy SB. Molecular mechanisms of antibacterial multidrug resistance. Cell. 2007;128:1037–1050. - PubMed
- Barrick JE, Yu DS, Yoon SH, Jeong H, Oh TK, Schneider D, Lenski RE, Kim JF. Genome evolution and adaptation in a long-term experiment with Escherichia coli. Nature. 2009;461:1243–1247. - PubMed
Publication types
MeSH terms
Substances
LinkOut - more resources
Full Text Sources
Other Literature Sources
Medical
Miscellaneous
