Mitochondrial reactive oxygen species (ROS) and ROS-induced ROS release - PubMed (original) (raw)
Review
Mitochondrial reactive oxygen species (ROS) and ROS-induced ROS release
Dmitry B Zorov et al. Physiol Rev. 2014 Jul.
Abstract
Byproducts of normal mitochondrial metabolism and homeostasis include the buildup of potentially damaging levels of reactive oxygen species (ROS), Ca(2+), etc., which must be normalized. Evidence suggests that brief mitochondrial permeability transition pore (mPTP) openings play an important physiological role maintaining healthy mitochondria homeostasis. Adaptive and maladaptive responses to redox stress may involve mitochondrial channels such as mPTP and inner membrane anion channel (IMAC). Their activation causes intra- and intermitochondrial redox-environment changes leading to ROS release. This regenerative cycle of mitochondrial ROS formation and release was named ROS-induced ROS release (RIRR). Brief, reversible mPTP opening-associated ROS release apparently constitutes an adaptive housekeeping function by the timely release from mitochondria of accumulated potentially toxic levels of ROS (and Ca(2+)). At higher ROS levels, longer mPTP openings may release a ROS burst leading to destruction of mitochondria, and if propagated from mitochondrion to mitochondrion, of the cell itself. The destructive function of RIRR may serve a physiological role by removal of unwanted cells or damaged mitochondria, or cause the pathological elimination of vital and essential mitochondria and cells. The adaptive release of sufficient ROS into the vicinity of mitochondria may also activate local pools of redox-sensitive enzymes involved in protective signaling pathways that limit ischemic damage to mitochondria and cells in that area. Maladaptive mPTP- or IMAC-related RIRR may also be playing a role in aging. Because the mechanism of mitochondrial RIRR highlights the central role of mitochondria-formed ROS, we discuss all of the known ROS-producing sites (shown in vitro) and their relevance to the mitochondrial ROS production in vivo.
Copyright © 2014 the American Physiological Society.
Figures
FIGURE 1.
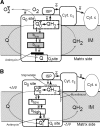
Model for the role of specific complex II inhibition for apoptosis induction by various proapoptotic compounds. Mitochondrial matrix, inner membrane (IM), intermembrane space, outer membrane (OM), and cytosolic space are indicated. A: in healthy cells, complex II serves to funnel electrons derived from the Krebs cycle to the respiratory chain. SDHA-mediated oxidation of succinate to fumarate by the succinate dehydrogenase activity (SDH), as part of the Krebs cycle, provides electrons to complex II. They are transferred to the iron-sulfur centers of the SDHB subunit and finally to the CoQ reduction site the succinate CoQ oxidoreductase (SQR). B: proapoptotic compounds, such as various anticancer drugs, FasL, or tumor necrosis factor (TNF)-α, induce cytosolic (pHc) and mitochondrial (pHM) acidification. These pH changes lead to the dissociation of the SDHA/B subunits from complex II and finally to the partial inhibition of the SQR activity without any impairment of the SDH reaction. This specific inhibition leads to complex II uncoupling, superoxide production, and apoptosis. [From Lemarie et al. (260). Reprinted by permission from Macmillan Publishers, Ltd.]
FIGURE 2.
Effect of the oxygen tension on the rates of phosphorylating respiration and H2O2 emission in rat liver mitochondria. (Note that there is no ROS production increase under low P
o
2.) [From Starkov (416), with permission from John Wiley & Sons.]
FIGURE 3.
Geometry of the Krogh cylinder-type model. Inner cylinder represents the capillary. Outer cylinder corresponds to tissue cylinder. Shaded area: example of hypoxic region under conditions of high demand. _R_t, tissue cylinder radius; _R_c, capillary radius; z, distance along the capillary. [From McGuire and Secomb (289).]
FIGURE 4.
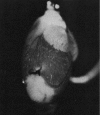
NADH fluorescence emission from perfused rat heart with a local ischemic area near the apex (seen as white areas), caused by ligation of a coronary artery. [From Korshunov et al. (33). Reprinted with permission from AAAS.]
FIGURE 5.
Relationship between mitochondrial ΔΨ and H2O2 production supported by succinate or NADH-linked respiratory substrates. A: rat heart mitochondria oxidizing succinate. The Δψ level was varied by adding different concentrations of uncoupler SF6847 (black squares and solid line), malonate (white squares), or 100 μM ADP and 5 mM P (triangle). Dashed line, the state 3 Δψ level. [From Korshunov et al. (240), with permission from Elsevier.] B: rat brain mitochondria oxidizing glutamate + malate or α-ketoglutarate. Differences in ΔΨ were generated by adding various concentrations of uncoupler FCCP ranging from 0 to 80 nM. Alternatively, a decrease in Δψ was induced by adding 0.8 mM ADP to mitochondria. [From Starkov and Fiskum (419), with permission from John Wiley & Sons.]
FIGURE 6.
Q-cycle model. The mechanism of superoxide formation in complex III (bcl1 complex). The reaction starts from the oxidation of the CoQ quinol (QH2) in a bifurcated electron transfer reaction at the Qo site of the complex III. The first electron is transferred to a high reduction potential chain consisting of the iron-sulfur protein (ISP, aka Rieske protein), cytochrome _c_1 (cyt _c_1), cytochrome c (cyt c), and further to cytochrome c oxidase (not shown). The remaining semiquinone (Qo−·) is unstable. It donates the second electron to the low reduction potential chain consisting of two cytochromes b, cyt _b_L and cyt _b_H, which serve as a pathway conducting electrons to the Qi site. There these electrons reduce another CoQ molecule. To provide two electrons required for the complete reduction of CoQ quinone at the Qi-site, the Qo-site oxidizes two QH2 molecules in two successive steps. The first electron at the Qi-site generates a stable semiquinone (Qi−) that is reduced to a quinol (QH2) by the second electron. Most frequently used inhibitors of complex III, stigmatellin and myxothiazol, prevent the transfer of the first electron to ISP and the binding of the quinol at the Qo site correspondingly. [Modified from Starkov and Fiskum (418), with permission from Elsevier.]
FIGURE 7.
Δψ loss in a significant fraction of mitochondria, caused by hypoxia/reoxygenation. Depolarized mitochondria (red-fluorescence ”holes“; bottom panels) are associated with increased ROS (green; bottom left panel). Hypoxic PC or pharmacological preconditioning (PC), represented by diazoxide (Dz), prevents mitochondrial depolarization, and 5-hydroxydecanoate (5HD) accentuates the loss. [From Hoffman et al. (189).]
FIGURE 8.
RIRR and MPT induction. A: confocal microscope fluorescence imaging of cardiac myocytes loaded with TMRM (red) and DCF-H2 (green). A, top: fluorescence image of TMRM-loaded cardiac myocyte. B: enlarged portion of the TMRM-loaded cardiac myocyte. Line drawn on image shows position scanned for experiment in bottom panel. C: row of mitochondria were line-scan imaged at 2 Hz with excitation at both 488 for DCF and 543 nm for TMRM and collecting simultaneous fluorescence emission at 510–550 nm and >560 nm, respectively. The sudden loss of Δψ and rise of ROS generation in individual mitochondria are indicated by the loss of TMRM fluorescence and increase in DCF fluorescence. B: cells dual-loaded with TMRM (Δψ) and calcein-AM (the latter loaded under conditions that results in a cytosolic distribution initially in excess over that in mitochondria); line-scan imaging at 2 Hz. For details, see Refs. , .
FIGURE 9.
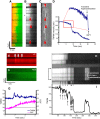
Transient Δψ hyperpolarization and depolarization (flickering) preceding MPT induction can be observed. A: overlay showing the 20-Hz linescan image in a cardiomyocyte loaded with TMRM (red) and DCF (green). B: the TMRM channel from A; arrows indicate examples of transient hyperpolarization immediately preceding Δψ loss (MPT induction). C: the directional derivative of the TMRM intensity with respect to time, to enhance the identification of intensity transients (transient hyperpolarization prior to MPT induction); arrows indicate examples of transient hyperpolarization (positive slope maxima) immediately preceding MPT. D: intensity plot of the TMRM responses of the mitochondrial pair indicated by the asterisk in B; inset shows an enlargement of the area inside the red box and shows transient (relative) hyperpolarization immediately preceding MPT. [From Zorov et al. (493), with permission from Elsevier.] E–G: ROS production (green) occurs during transient mitochondrial hyperpolarization flickering (red image, arrows in E). H–I: 2-Hz line scan image in a cardiomyocyte loaded with TMRM. Transient hyperpolarization and depolarization spikes are seen as white and black vertical lines (shown by the arrows from 1 to 7). TMRM fluorescence intensity (Δψ) in the region of the cardiomyocyte denoted by the arrow-bracket in H (∼6 μm in width, consisting of 3 sarcomere-associated pairs of mitochondria) within which mitochondria display concerted flickerings of the membrane potential. Note that these transient depolarizations, during the time interval between arrows 1–7, are accompanied by progressive mitochondrial swelling (as seen by the lateral displacement of adjacent mitochondria) consistent with repeated transient MPT-induction episodes.
FIGURE 10.
Induction of Ca2+ sparks after the mPTP. Cell is dual-loaded with TMRM (Δψ) and fluo-3 (Ca2+) and line-scan imaged at 230 Hz. Representative example showing the dissipation of TMRM fluorescence from a single mitochondrion and a cluster of Ca2+ sparks in the immediate vicinity, within seconds of MPT induction. Inset: comparison of Ca2+ spark rate in proximity of the mPTP occurrence, i.e., within the sarcomere containing the involved mitochondria and within 3 s after the mPTP occurrence. [From Zorov et al. (491).]
FIGURE 11.
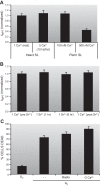
Ca2+ dependence of the mPTP in rat adult cardiac myocytes. A: mPTP ROS threshold during a “clamp” of intracellular Ca2+ >500nM for >20 min (using 10-Hz electrical tetanization in 5 mM bathing Ca2+ in the presence of thapsigargin or cyclopiazonic acid to disable the sarcoplasmic reticulum) is identical to that in unstimulated cells (with a cytoplasmic Ca2+ of ∼100 nM). B: complete equimolar replacement of Ca2+ for Sr2+ (for 6 h) in intact cardiac myocytes resulted in the same mPTP ROS threshold as seen in cells with normal Ca2+. C: buffering intracellular Ca2+ (with BAPTA) or limiting Ca2+ influx (in nominally Ca2+-free buffer) does not limit cardiac myocyte death after hypoxia/reoxygenation. [From Juhaszova et al. (218). Republished with permission from the American Society for Clinical Investigation; permission conveyed through Copyright Clearance Center, Inc.]
FIGURE 12.
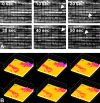
Oscillations of Δψ in individual mitochondria over time in a portion of a cardiac myocyte induced by 10 μM clotrimazole. Panels of consecutive fluorescence frames with a different interval indicated in each plane 10 s acquired from either a 18 × 15 μm region of an adult cardiac myocyte [A; from Zorov et al. (493), with permission from Elsevier.] or neonatal cardiac myocytes loaded with TMRM (B). Arrows indicate individual mitochondria or mitochondrial clusters displaying periodic changes in the membrane potential.
FIGURE 13.
Hypothetical scheme of the IMAC-associated ROS-induced ROS release mechanism underlying the synchronization of mitochondrial activity during the oscillations. [Modified from Aon et al. (18), with permission from The American Society for Biochemistry and Molecular Biology.]
FIGURE 14.
ROS are involved in mitochondria and cell deterioration. A: hypoxia/reoxygenation-induced mitochondrial hyperpolarization leads to increased ROS. Mitochondria stained with TMRM (Δψ, red) and DCF (ROS, green) were laser line-scanned (2 Hz) during hypoxia and the reoxygenation phase. The ROS burst is delayed after reoxygenation and starts at the maximum Δψ. Mitochondrial hyperpolarization lasts for ∼2 min, followed by loss of Δψ. B: cell survival after constant-energy photoexcitation of a 25 × 25 μm2 region. Right panels show TMRM-stained cardiomyocyte (red) immediately after, and 1 h after, irradiation. Survival is inversely related to the fraction of mitochondria (mito) undergoing mPTP induction and is improved by ROS scavenger (Trolox), NO donor (SNAP), and the KATP channel opener diazoxide (Dz) and is impaired by 5-hydroxydecanoate (5HD), the blocker of KATP channel. [From Juhaszova et al. (218). Republished with permission from the American Society for Clinical Investigation; permission conveyed through Copyright Clearance Center, Inc.]
FIGURE 15.
Linescan technique applied to mitochondria in rat cardiac myocytes. A: definition of the mPTP ROS threshold as an average time over population of mitochondria (shown by a dashed red line) in myocyte stained with fluorescent mitochondrial probe for the membrane potential to induce the mPTP (shown by arrow) (491, 493). B: dependence of the mPTP induction in the cell on ambient molecular oxygen.
FIGURE 16.
Basic mitochondrial redox states (see explanation in the text). A: unstressed mitochondria with high tolerance to ROS (high survival). B: stressed mitochondria with low tolerance to ROS (low survival). C: stressed mitochondria with high tolerance to ROS (unknown survival).
FIGURE 17.
Tentative model of regulation of the mitochondrial quality control by Δψ. Parkin is an E3 ubiquitin ligase located in the cytosol, while PINK1 is a mitochondrial kinase carrying mitochondrial import sequence to be accumulated inside of mitochondria followed by degradation by PARL. Δψ drives PINK1 into mitochondria where it is processed by mitochondrial processing protease (MMP). When mitochondrial membrane potential is dissipated, PINK1 accumulates on the outer mitochondrial membrane, where it can recruit Parkin to impaired mitochondria followed by its ubiquitination as a starting point for mitophagy. OM, outer membrane; IM, inner membrane. TOM and TIM are transport outer and inner membrane proteins correspondingly. (From Ref. : Copyright 2010 Jin et al. Originally published in Journal of Cell Biology. 191: 933–942. doi:10.1083/jcb.201008084.)
FIGURE 18.
Two-ROS thresholds scheme for the induction of the mPTP. Resting state (shown by a pink ball) is a state with a stable closed mPTP. After depletion of a redox buffer, the pore may undergo a transition to a metastable flickering state (I) (shown by yellow color). The flickering mode of the pore is accompanied by a small release of ROS from mitochondria, and when low it serves a physiological housekeeping purposes as a release valve and when higher it is enough to precondition the system for better output after the following, more extensive oxidative challenge (180). If the oxidative stress is severe, the phase I is changed by a state II (shown by red) characterized by a stable open mPTP accompanied by a ROS burst. The pathological ROS burst results in a programmed elimination of unwanted organelles or cells. The critical height of the ROS threshold is determined by a balance between ROS production and quenching within mitochondria. It can be raised by protective signaling [through preconditioning (218), cyclosporin A (180, 218), sanglofehrin (89), acidosis (47), cyclophilin D acetylation or its knockout (26, 34, 313, 387)] shown by a green dotted line. Low redox buffering (491), low SIRT3 activity (387), hexokinase II detachment from mitochondria (86), as well as high age (216, 487) drive the threshold II down (shown by a brown dotted line). Note that one of the most important elements of the scheme is that the long occupancy in state I hardens the onset of the state II.
Similar articles
- Mitochondrial oscillations and waves in cardiac myocytes: insights from computational models.
Yang L, Korge P, Weiss JN, Qu Z. Yang L, et al. Biophys J. 2010 Apr 21;98(8):1428-38. doi: 10.1016/j.bpj.2009.12.4300. Biophys J. 2010. PMID: 20409461 Free PMC article. - Mitochondrial ROS-induced ROS release: an update and review.
Zorov DB, Juhaszova M, Sollott SJ. Zorov DB, et al. Biochim Biophys Acta. 2006 May-Jun;1757(5-6):509-17. doi: 10.1016/j.bbabio.2006.04.029. Epub 2006 May 23. Biochim Biophys Acta. 2006. PMID: 16829228 Review. - The effect of permeability transition pore opening on reactive oxygen species production in rat brain mitochondria.
Akopova OV, Kolchynskayia LY, Nosar' VY, Smyrnov AN, Malisheva MK, Man'kovskaia YN, Sahach VF. Akopova OV, et al. Ukr Biokhim Zh (1999). 2011 Nov-Dec;83(6):46-55. Ukr Biokhim Zh (1999). 2011. PMID: 22364018 - A wave of reactive oxygen species (ROS)-induced ROS release in a sea of excitable mitochondria.
Brady NR, Hamacher-Brady A, Westerhoff HV, Gottlieb RA. Brady NR, et al. Antioxid Redox Signal. 2006 Sep-Oct;8(9-10):1651-65. doi: 10.1089/ars.2006.8.1651. Antioxid Redox Signal. 2006. PMID: 16987019 Review. - Biophysical properties and functional consequences of reactive oxygen species (ROS)-induced ROS release in intact myocardium.
Biary N, Xie C, Kauffman J, Akar FG. Biary N, et al. J Physiol. 2011 Nov 1;589(Pt 21):5167-79. doi: 10.1113/jphysiol.2011.214239. Epub 2011 Aug 8. J Physiol. 2011. PMID: 21825030 Free PMC article.
Cited by
- PINK1/Parkin-Mediated Mitophagy Ameliorates Mitochondrial Dysfunction in Lacrimal Gland Acinar Cells During Aging.
Zhao H, Zhang Y, Ren Y, Wang W. Zhao H, et al. Invest Ophthalmol Vis Sci. 2024 Nov 4;65(13):12. doi: 10.1167/iovs.65.13.12. Invest Ophthalmol Vis Sci. 2024. PMID: 39504053 Free PMC article. - Activation of lysosomal Ca2+ channels mitigates mitochondrial damage and oxidative stress.
Feng X, Cai W, Li Q, Zhao L, Meng Y, Xu H. Feng X, et al. J Cell Biol. 2025 Jan 6;224(1):e202403104. doi: 10.1083/jcb.202403104. Epub 2024 Nov 5. J Cell Biol. 2025. PMID: 39500490 - 3-Oxo-11αH-germacra-1(10) E,4Z-dien-12,6α-olide, a sesquiterpene from Artemisia sieversiana, attenuates lipopolysaccharide-induced inflammation via NF-κB/MAPK pathways and oxidative stress via ROS pathway in RAW264.7 cells.
Ren Q, Wang L, Wang X, Min X, Dai X, Huang G, Cao J. Ren Q, et al. J Nat Med. 2024 Nov 5. doi: 10.1007/s11418-024-01854-7. Online ahead of print. J Nat Med. 2024. PMID: 39499482 - Heightened mitochondrial respiration in CF cells is normalised by triple CFTR modulator therapy through mechanisms involving calcium.
Jarosz-Griffiths HH, Caley LR, Lara-Reyna S, Savic S, Clifton IJ, McDermott MF, Peckham DG. Jarosz-Griffiths HH, et al. Heliyon. 2024 Oct 11;10(20):e39244. doi: 10.1016/j.heliyon.2024.e39244. eCollection 2024 Oct 30. Heliyon. 2024. PMID: 39498005 Free PMC article. - Exploring paraptosis as a therapeutic approach in cancer treatment.
Chang LC, Chiang SK, Chen SE, Hung MC. Chang LC, et al. J Biomed Sci. 2024 Nov 4;31(1):101. doi: 10.1186/s12929-024-01089-4. J Biomed Sci. 2024. PMID: 39497143 Free PMC article. Review.
References
- A man driven by proticity: Peter Mitchell Nobel prize for Chemistry 1978. Nature 276: 8–9, 1978 - PubMed
- Adam-Vizi V, Chinopoulos C. Bioenergetics and the formation of mitochondrial reactive oxygen species. Trends Pharmacol Sci 27: 639–645, 2006 - PubMed
Publication types
MeSH terms
Substances
LinkOut - more resources
Full Text Sources
Other Literature Sources
Miscellaneous


