Yap tunes airway epithelial size and architecture by regulating the identity, maintenance, and self-renewal of stem cells - PubMed (original) (raw)
. 2014 Jul 28;30(2):151-65.
doi: 10.1016/j.devcel.2014.06.004. Epub 2014 Jul 17.
Timothy R Fallon 2, Srinivas Vinod Saladi 3, Ana Pardo-Saganta 1, Jorge Villoria 2, Hongmei Mou 1, Vladimir Vinarsky 1, Meryem Gonzalez-Celeiro 2, Naveen Nunna 2, Lida P Hariri 4, Fernando Camargo 5, Leif W Ellisen 3, Jayaraj Rajagopal 6
Affiliations
- PMID: 25043474
- PMCID: PMC4130488
- DOI: 10.1016/j.devcel.2014.06.004
Yap tunes airway epithelial size and architecture by regulating the identity, maintenance, and self-renewal of stem cells
Rui Zhao et al. Dev Cell. 2014.
Abstract
Our understanding of how stem cells are regulated to maintain appropriate tissue size and architecture is incomplete. We show that Yap (Yes-associated protein 1) is required for the actual maintenance of an adult mammalian stem cell. Without Yap, adult airway basal stem cells are lost through their unrestrained differentiation, resulting in the simplification of a pseudostratified epithelium into a columnar one. Conversely, Yap overexpression increases stem cell self-renewal and blocks terminal differentiation, resulting in epithelial hyperplasia and stratification. Yap overexpression in differentiated secretory cells causes them to partially reprogram and adopt a stem cell-like identity. In contrast, Yap knockdown prevents the dedifferentiation of secretory cells into stem cells. We then show that Yap functionally interacts with p63, the cardinal transcription factor associated with myriad epithelial basal stem cells. In aggregate, we show that Yap regulates all of the cardinal behaviors of airway epithelial stem cells and determines epithelial architecture.
Copyright © 2014 Elsevier Inc. All rights reserved.
Figures
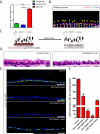
Figure 1
Yap Is Required for the Maintenance of Adult Airway Basal Stem Cells and Yap Loss Results in the Simplification of a Pseudostratified Epithelium into a Columnar Epithelium (A) Expression of Yap mRNA in basal and secretory cells relative to that in ciliated cells. (B) Immunostaining for Yap (red) and the basal stem cell marker Cytokeratin 5 (CK5, green). Yap protein is highly enriched in the nuclei of basal stem cells (white arrows) as compared to differentiated cells (yellow arrowheads). (C) A schematic of the strategy and phenotypic outcome of stem cell-specific Yap deletion. (D) Hematoxylin and eosin (H&E) staining of tracheal sections from control (left panel) and CK5-YapKO (right panel) animals. Control animals bear only the CK5 rtTA and tetO Cre alleles. (E) Immunofluorescence analysis of basal stem cell markers p63 (red) and CK5 (green) in control, CK5-YapKO and CK5-YapHet tracheal sections after doxycycline treatment. (F) Quantification of basal stem cells marked by p63 in control, CK5-YapKO and CK5-YapHet tracheal sections. Data are represented as mean +/− SEM. n=3 for each genotype per each time point. DAPI is in blue. Scale bar represents 10 μm in B and E, and 5 μm in D. See also Figure S1.
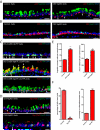
Figure 2
Basal Stem Cells Undergo Differentiation Following Yap Loss (A) Expression of p63 (red) and secretory cell marker Scgb3A2 (green) are mutually exclusive in control epithelium. In CK5-YapKO trachea double-positive cells (arrows) are observed four weeks after continuous doxycycline administration. (B) Expression of CK5 (red) and ciliated cell marker FoxJ1 (green) are mutually exclusive in control epithelium. Double-positive cells (arrow) are detected in CK5-YapKO trachea. (C) Lineage tracing of basal stem cells following Yap loss. The YFP reporter (green) is restricted to CK5-expressing (red, top panel) basal stem cells two weeks after tamoxifen induction in control animals carrying the CK5-CreER and LSL-YFP alleles. In the experimental animals carrying the CK5-CreER, YapF/F and LSL-YFP alleles, YFP+ (green) and CC10-expressing (red, middle panel) secretory cells and the YFP+ (green) and FoxJ1-expressing (red, bottom panel) ciliated cells are frequently detected. White arrows point to double-positive cells. (D) Scgb3A2 (green, upper panel) and FoxJ1 (green, lower panel) are expressed in cells in which Yap (red) is absent, demonstrating that basal stem cells that have lost Yap (arrows) go on to terminally differentiate. (E) Quantification of Scgb3A2+ secretory cells and FoxJ1+ ciliated cells per tracheal section reveals a significant increase in differentiated epithelial cell numbers in CK5-YapKO animals. (F) Quantification of the percentage of p63+ cells as a proportion of virally infected GFP+ cells reveals that basal stem cells are lost following Yap knockdown (left panel). The large majority of these GFP+ infected cells differentiate into CK8+ cells (right panel). Data are represented as mean +/− SEM. Scale bar represents 15 μm in Figure A, B and D (top panel), and 10 μm in Figure C and D (bottom panel). See also Figure S2.
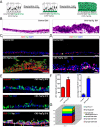
Figure 3
Yap Overexpression Promotes Stem Cell Proliferation and Inhibits Terminal Differentiation Resulting in Epithelial Hyperplasia and Stratification (A) Schematic representation of the experimental design and phenotypic outcome of Yap overexpression in CK5+ basal stem cells. (B) H & E staining of tracheal sections from CK5-YapTg animals demonstrates epithelial stratification following 21 days of Yap overexpression. (C) CK5 (red) and Yap (green) co-staining demonstrates an increase in CK5+ cells in CK5-YapTg tracheal epithelium 21 days after doxycycline induction. (D) Immunostaining for p63 (red) and Ki-67 (green) reveals an increase in basal stem cells and their proliferation in CK5-YapTg tracheal epithelium 21 days after doxycycline induction. (E) Expression of Scgb3A2 (red, top panel) and FoxJ1 (red, middle panel) is not detected in Yap-overexpressing cells (green) 10 days after doxycycline treatment. Some cells overexpressing Yap (white in lower panel) also co-express CK8 (green), indicating that a preliminary differentiation program has occurred but that terminal differentiation has been blocked. Red arrows point to Yap+CK5+CK8− cells. Yellow arrows point to Yap+CK5+CK8+ cells. White arrows point to Yap+CK5−CK8+ cells. (F) Graphs showing the total number of p63+ cells (left) and the percentage of proliferating basal stem cells (p63+ Ki-67+, right) demonstrate that basal stem cell numbers and their proliferation rates increase after Yap overexpression. (G) A column chart showing the relative abundance of p63+CK5+CK8− basal stem cells (red), p63−CK5+CK8− progenitor cells (blue), p63−CK5+CK8+ progenitor cells (green), p63−CK5−CK8+Scgb3A2−FoxJ1− progenitor cells (yellow), Scgb3A2+ secretory cells (purple) and FoxJ1+ ciliated cells (cyan) in Yap-overexpressing epithelial cells 21 days after doxycycline treatment. Data are represented as mean +/− SEM. Scale bar represents10 μm in B, D and E, and 20 μm in C. See also Figure S3.
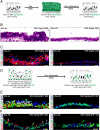
Figure 4
Normalizing Yap Expression Restores Pseudostratified Epithelial Architecture and a Normally Sized Basal Stem Cell Pool (A) A schematic of the experimental strategy and phenotypic result of an experiment designed to test whether normalizing Yap signaling in a stratified epithelium restores normal basal stem cell numbers and pseudostratified epithelial architecture. (B) H&E staining reveals the restoration of a normal pseudostratified epithelium after the discontinuation of doxycycline-induced Yap overexpression. (C) Immunostaining for CK5+ basal stem cells (red) and Ki-67 (green) reveals a normalization of stem cell numbers and proliferation rates following doxycycline withdrawal. The arrow points to a basal stem cell that is double-positive for CK5 and Ki-67. (D) Experimental strategy for using long-lived H2BGFP expression as a lineage tracing tool for tracing the behavior of stem and progenitor cells that have previously overexpressed Yap. (E) Expression of GFP (green) is detected in the majority of the cells that overexpress Yap (red, left panel) following doxycycline treatment. Ectopic Yap expression is no longer detected following one week of doxycycline withdrawal whereas strong GFP lineage label perdures (green, right panel). (F) Scgb3A2 (red, left panel) and FoxJ1 (red, right panel) occur in H2BGFP+ (green) cells two weeks after doxycycline removal (arrows point to double-positive cells). Scale bar = 20 μm in B, C, E and F. See also Figure S4.
Figure 5
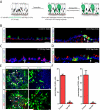
The Overexpression of Yap in Secretory Cells Causes Them to Adopt a Basal-like Program (A) Schematic of the strategy to inducibly overexpress Yap in GFP lineage tagged secretory cells. Following Yap induction, some GFP tagged secretory cells adopt a basal stem cell-like identity. (B) Co-staining of the secretory cell lineage tag GFP with the basal stem cell marker T1α (red) shows that GFP is associated with normal columnar cells and not basal stem cells in control animals (left panel). In experimental animals, GFP+ T1α+ basal-like cells derived from Yap-overexpressing secretory cells are observed (right panel, arrows). (C) A pyramidal basal-like cell expressing p63 (red) and ectopic Yap (green) reveals that the stem-like cell was derived from a Yap-overexpressing secretory cell (arrow). (D) Expression of Scgb3A2 (red) is lost in pyramidal Yap-overexpressing (green) secretory-derived cells (arrow). (E) Yap knockdown using GFP-expressing lentivirus prevents the dedifferentiation of secretory cells into basal stem cell as demonstrated by the absence of p63 (red, top panels) and CK5 (red, bottom panels) staining in GFP+ infected cells as opposed to controls. Arrowheads point to GFP+ cells infected with control viruses that do dedifferentiate into p63+ and CK5+ basal stem cells. (F) Quantification of p63+ and CK5+ basal stem cells as a fraction of all GFP+ infected cells in scrambled control and Yap knockdown secretory cell cultures reveals that inhibition of Yap prevents secretory cell dedifferentiation into stem cells. Data are represented as mean +/− SEM. Scale bar represents 20 μm in B, C, D and 100 μm in E. See also Figure S5.
Figure 6
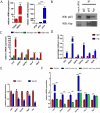
Yap and p63 Interact in Basal Stem Cells and Regulate Common Target Genes (A) Quantitative-PCR analysis demonstrates that Δ_Np63_α is the major p63 transcript expressed in sorted basal stem cells. (B) Immunoprecipitation demonstrates that Yap interacts with p63 in human basal stem cells. (C) Quantitative-PCR analysis of p63 target genes demonstrates that these targets are more enriched in basal stem cells. (D) Chromatin immunoprecipitation demonstrates that Yap binds to the promoters of p63 target genes. (E) Decrease in mRNA expression of p63 target genes following Yap knockdown. (F) Gene expression analysis shows an increase in mRNA expression of p63 target genes following Yap overexpression, but this effect is abolished when p63 is knocked down. Data are represented as mean +/− SEM. See also Figure S6.
Figure 7
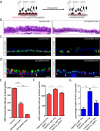
p63 and Yap Genetically Interact (A) A schematic of the strategy for basal stem cell-specific p63 deletion. It is hypothesized that p63 deletion results in a loss of basal stem cells (red) mirroring Yap deletion. (B) H&E staining of tracheal sections from control (left panel) and experimental CK5-p63KO (right panel) animals reveals a simplification of a normally pseudostratified epithelium into a columnar epithelium following p63 deletion. Controls animals bear only the CK5 rtTA and tetO Cre alleles. (C) Immunostaining for p63 (red) and CK5 (green) reveals a significant decrease in total basal stem cell numbers in CK5-p63KO tracheal sections as compared to that in control mice possessing only the CK5 rtTA and tetO Cre alleles. (D) Detection of transitional cells double-positive for CK5 (red) and CC10 (green) (left panel) as well as CK5 (red) and FoxJ1 (green) (right panel) in CK5-p63KO trachea two weeks after doxycycline administration. Arrows point to the double-positive cells. (E) Quantification of CK5+ basal stem cells per standard tracheal section following p63 loss. (F) Quantification of p63+ cell numbers reveals that a loss of one copy of p63 significantly suppresses the increase in basal stem cells numbers caused by Yap overexpression. (G) Quantification of p63+ Ki-67+ cells reveals that the loss of one copy of p63 significantly suppresses the increased basal stem cell proliferation caused by Yap overexpression. Data are represented as mean +/− SEM. Scale bar represents 5 μm in B, and10 μm in C and D. See also Figure S7.
Comment in
- Sizing up lung stem cells.
Rock JR. Rock JR. Dev Cell. 2014 Jul 28;30(2):112-4. doi: 10.1016/j.devcel.2014.07.002. Dev Cell. 2014. PMID: 25073150
Similar articles
- Hippo/Yap signaling controls epithelial progenitor cell proliferation and differentiation in the embryonic and adult lung.
Lange AW, Sridharan A, Xu Y, Stripp BR, Perl AK, Whitsett JA. Lange AW, et al. J Mol Cell Biol. 2015 Feb;7(1):35-47. doi: 10.1093/jmcb/mju046. Epub 2014 Dec 5. J Mol Cell Biol. 2015. PMID: 25480985 Free PMC article. - Crumbs3-Mediated Polarity Directs Airway Epithelial Cell Fate through the Hippo Pathway Effector Yap.
Szymaniak AD, Mahoney JE, Cardoso WV, Varelas X. Szymaniak AD, et al. Dev Cell. 2015 Aug 10;34(3):283-96. doi: 10.1016/j.devcel.2015.06.020. Epub 2015 Jul 30. Dev Cell. 2015. PMID: 26235047 Free PMC article. - Sizing up lung stem cells.
Rock JR. Rock JR. Dev Cell. 2014 Jul 28;30(2):112-4. doi: 10.1016/j.devcel.2014.07.002. Dev Cell. 2014. PMID: 25073150 - [Regulation of differentiation of mesenchymal stem cells by the Hippo pathway effectors TAZ/YAP].
Men T, Piao SH, Teng CB. Men T, et al. Yi Chuan. 2013 Nov;35(11):1283-90. doi: 10.3724/sp.j.1005.2013.01283. Yi Chuan. 2013. PMID: 24579311 Review. Chinese. - Signaling circuitries controlling stem cell fate: to be or not to be.
Iglesias-Bartolome R, Gutkind JS. Iglesias-Bartolome R, et al. Curr Opin Cell Biol. 2011 Dec;23(6):716-23. doi: 10.1016/j.ceb.2011.08.002. Epub 2011 Aug 29. Curr Opin Cell Biol. 2011. PMID: 21880478 Free PMC article. Review.
Cited by
- Understanding Lung Carcinogenesis from a Morphostatic Perspective: Prevention and Therapeutic Potential of Phytochemicals for Targeting Cancer Stem Cells.
Heng WS, Kruyt FAE, Cheah SC. Heng WS, et al. Int J Mol Sci. 2021 May 27;22(11):5697. doi: 10.3390/ijms22115697. Int J Mol Sci. 2021. PMID: 34071790 Free PMC article. Review. - SARS-CoV-2 Infection and Lung Regeneration.
Zhao F, Ma Q, Yue Q, Chen H. Zhao F, et al. Clin Microbiol Rev. 2022 Apr 20;35(2):e0018821. doi: 10.1128/cmr.00188-21. Epub 2022 Feb 2. Clin Microbiol Rev. 2022. PMID: 35107300 Free PMC article. Review. - Hippo signaling promotes lung epithelial lineage commitment by curbing Fgf10 and β-catenin signaling.
Volckaert T, Yuan T, Yuan J, Boateng E, Hopkins S, Zhang JS, Thannickal VJ, Fässler R, De Langhe SP. Volckaert T, et al. Development. 2019 Jan 16;146(2):dev166454. doi: 10.1242/dev.166454. Development. 2019. PMID: 30651296 Free PMC article. - The Hippo Signaling Pathway in Development and Disease.
Zheng Y, Pan D. Zheng Y, et al. Dev Cell. 2019 Aug 5;50(3):264-282. doi: 10.1016/j.devcel.2019.06.003. Dev Cell. 2019. PMID: 31386861 Free PMC article. Review. - SARS-CoV-2 leverages airway epithelial protective mechanism for viral infection.
Greaney AM, Raredon MSB, Kochugaeva MP, Niklason LE, Levchenko A. Greaney AM, et al. iScience. 2023 Mar 17;26(3):106175. doi: 10.1016/j.isci.2023.106175. Epub 2023 Feb 10. iScience. 2023. PMID: 36788793 Free PMC article.
References
- Barry ER, Camargo FD. The Hippo superhighway: signaling crossroads converging on the Hippo/Yap pathway in stem cells and development. Curr Opin Cell Biol. 2013;25:247–253. - PubMed
- Camargo FD, Gokhale S, Johnnidis JB, Fu D, Bell GW, Jaenisch R, Brummelkamp TR. YAP1 increases organ size and expands undifferentiated progenitor cells. Curr Biol. 2007;17:2054–2060. - PubMed
Publication types
MeSH terms
Substances
Grants and funding
- R01 HL118185/HL/NHLBI NIH HHS/United States
- R01 HL116756/HL/NHLBI NIH HHS/United States
- U01 HL099997/HL/NHLBI NIH HHS/United States
- T32 CA009216/CA/NCI NIH HHS/United States
- 5P30HL101287-02/HL/NHLBI NIH HHS/United States
- 1R01HL116756-01A/HL/NHLBI NIH HHS/United States
- R01 DE015945/DE/NIDCR NIH HHS/United States
- 5U01HL099997-04/HL/NHLBI NIH HHS/United States
- P30 HL101287/HL/NHLBI NIH HHS/United States
LinkOut - more resources
Full Text Sources
Other Literature Sources
Molecular Biology Databases
Research Materials
