Selective repression of the oncogene cyclin D1 by the tumor suppressor miR-206 in cancers - PubMed (original) (raw)
Selective repression of the oncogene cyclin D1 by the tumor suppressor miR-206 in cancers
S J Elliman et al. Oncogenesis. 2014.
Abstract
MicroRNAs (miRNAs) are deregulated in cancer and have been shown to exhibit both oncogenic and tumor suppressive functions. Although the functional effects of several miRNAs have been elucidated, those of many remain to be discovered. In silico analysis identified microRNA-206 (miR-206) binding sites in the 3'-untranslated regions (3'-UTR) of both the mouse and human CCND1 gene. Cyclin D1 is a recognized oncogene involved in direct phosphorylation of the retinoblastoma (Rb) protein and promoting cell cycle transition from G1 to S. miR-206 specifically binds to the CCND1 3'-UTR and mediates reduction of both cyclin D1 protein and mRNA. Expression of miR-206 induced a G1 arrest and a decrease in cell proliferation in breast cancer cells. Ectopic expression of miRNA-resistant cyclin D1 was able to reverse the miR-206-induced decrease in cell proliferation. Therefore, we identified miR-206 as an activator of cell cycle arrest resulting in a decrease in cell proliferation that is dependent on the inhibition of cyclin D1. Interestingly, prostatic cancer (PCa) cells express low levels of miR-206 resulting in deregulated cyclin D1 expression compared with non-transformed primary prostatic epithelial cells (PrEC). Finally, we demonstrate that cyclin D1 is regulated by miR-206 in PrEC but not in PCa cells and this is due to the absence of a CCND1 3'-UTR in these cells. This suggests that miR-206-based anti-cyclin D1 targeted therapy would be beneficial in cancers where cyclin D1 is overexpressed and contains a 3'-UTR.
Figures
Figure 1
miR-206 directly targets CCND1 at a specific 3′-UTR site. (a) Schematic of putative miR-206 target site within the human CCND1 3′-UTR as predicted by TargetScan and PicTar algorithms. Mutations introduced into the full-length human CCND1 3′-UTR are highlighted in red. (b) Relative luciferase activity was measured in 3T3-L1 cells co-transfected with a luciferase reporter construct containing a fragment of the mouse Ccnd1 3′-UTR encompassing the miR-206 binding site or empty pMIR-Report vector, along with miR-ve or miR-206. Data represent relative Firefly values as determined by the ratio of Firefly to Renilla luciferase activity with control miR-ve set as 1. Values are the mean±s.e.m. of three separate experiments. (c) Relative luciferase activity was measured in H1299 cells co-transfected with reporter constructs containing human full-length wild-type (WT)-CCND1 3′-UTR or mutant (MUT)-CCND1 3′-UTR along with miR-ve or miR-206. Firefly luciferase units were normalized against Renilla luciferase units to control for transfection efficiency. Percentage Firefly luciferase values were determined with control miR-ve set at 100%. Data represent the mean+s.e.m. of three independent experiments. A paired _t_-test was used to determine significance between miR-ve and miR-206 transfected cells (* indicates P<0.05).
Figure 2
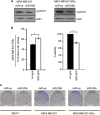
miR-206 inhibits cyclin D1 expression in breast cancer cells. MDA-MB-231, MDA-MB-231-ERα or MCF-7 cells were reverse transfected with miR-ve or miR-206. (a) Forty-eight hours later, protein extracts were prepared and western blot analysis was performed to determine cyclin D1 protein levels. Beta-actin served as a loading control. Immunoblots are representative of three independent experiments. (b) Seventy-two hours later, cells were fixed, stained with propidium iodide and cell cycle distribution was assessed by flow cytometry. Graphical representation of percentage of cells in G1 phase following transfection with miR-ve (black bar) or mir-206 (white bar). Data represent the mean±s.e.m. of three independent experiments, and a paired _t_-test was used to determine the significance between miR-ve and miR-206 expressing cells (left panel). Cell viability was determined by MTT assay. Values represent the mean±s.e.m. of three independent experiments and a paired _t_-test was performed between miR-ve and miR-206 transfected cells (right panel). (c) Forty-eight hours later cells were trypsinized, counted and 500 cells were plated in a 10-cm dish and analyzed for clonogenic survival.
Figure 3
miRNA-resistant cyclin D1 reverses the miR-206-induced decrease in cell survival. MDA-MB-236 cells were co-transfected with a CCND1 expression vector or empty vector control and miR-ve or miR-206. Twenty-four hours later, cells were (a) harvested for western blot analysis. (b) Analyzed for clonogenic survival. _n_=3 **_P_=0.019. (c) Graphical representation of three independent experiments. Values are mean±s.e.m. Percentage cell survival was determined with control miR-ve set at 100%. A paired _t_-test was used to determine the significance between miR-ve and miR-206 expressing cells, **_P_=0.006.
Figure 4
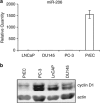
Relationship between miR-206 and cyclin D1 expression in normal and cancer prostate cells. RNA was prepared from LNCaP, DU145, PC-3 and PrEC cells. (a) Levels of miR-206 were determined by real-time quantitative PCR (RT-qPCR). RNU24 levels were used as a loading control. Values represent mean±s.e.m. (b) Protein extracts were prepared from LNCaP, PC-3, DU145 and PrEC cells and analyzed by western blot for cyclin D1 expression. Beta-actin served as a loading control.
Figure 5
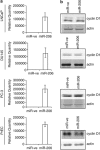
Differential effects of miR-206 in primary and prostate cancer cell lines. LNCaP, DU145, PC-3 and PrEC cells were reverse transfected with miR-ve or miR-206 for 48 h. (a) RNA extracts were prepared and miR-206 levels were determined by qRT-PCR. RNU24 levels were used as a loading control. (b) CSK extracts were prepared and cyclin D1 protein levels were determined by western blot analysis. Actin served as a loading control.
Figure 6
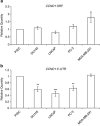
Prostatic cancer cells lack a CCND1 3′-UTR. RNA from PrEC, DU145, LNCaP, PC-3 and MDA-MB-231 cells was reversed transcribed into cDNA. qPCR was used to amplify (a) the CCND1 ORF and (b) the CCND1 3′-UTR from these various cell lines. Shown is the average relative quantity (±s.e.m.) of four experiments normalized to TATA-binding protein (TBP) and to the amount of RNA expressed in PrEC.
Similar articles
- miR-449a causes Rb-dependent cell cycle arrest and senescence in prostate cancer cells.
Noonan EJ, Place RF, Basak S, Pookot D, Li LC. Noonan EJ, et al. Oncotarget. 2010 Sep;1(5):349-58. doi: 10.18632/oncotarget.167. Oncotarget. 2010. PMID: 20948989 Free PMC article. - microRNA-16-5p enhances radiosensitivity through modulating Cyclin D1/E1-pRb-E2F1 pathway in prostate cancer cells.
Wang F, Mao A, Tang J, Zhang Q, Yan J, Wang Y, Di C, Gan L, Sun C, Zhang H. Wang F, et al. J Cell Physiol. 2019 Aug;234(8):13182-13190. doi: 10.1002/jcp.27989. Epub 2018 Dec 10. J Cell Physiol. 2019. PMID: 30536619 - MicroRNA-551b-3p inhibits tumour growth of human cholangiocarcinoma by targeting Cyclin D1.
Chang W, Wang Y, Li W, Shi L, Geng Z. Chang W, et al. J Cell Mol Med. 2019 Aug;23(8):4945-4954. doi: 10.1111/jcmm.14312. Epub 2019 Jun 14. J Cell Mol Med. 2019. PMID: 31199052 Free PMC article. - Embryonic stem cell microRNAs: defining factors in induced pluripotent (iPS) and cancer (CSC) stem cells?
Gunaratne PH. Gunaratne PH. Curr Stem Cell Res Ther. 2009 Sep;4(3):168-77. doi: 10.2174/157488809789057400. Curr Stem Cell Res Ther. 2009. PMID: 19492978 Review. - Mechanism of cyclin D1 (CCND1, PRAD1) overexpression in human cancer cells: analysis of allele-specific expression.
Hosokawa Y, Arnold A. Hosokawa Y, et al. Genes Chromosomes Cancer. 1998 May;22(1):66-71. doi: 10.1002/(sici)1098-2264(199805)22:1<66::aid-gcc9>3.0.co;2-5. Genes Chromosomes Cancer. 1998. PMID: 9591636 Review.
Cited by
- MicroRNAs: New Biomarkers for Diagnosis, Prognosis, Therapy Prediction and Therapeutic Tools for Breast Cancer.
Bertoli G, Cava C, Castiglioni I. Bertoli G, et al. Theranostics. 2015 Jul 13;5(10):1122-43. doi: 10.7150/thno.11543. eCollection 2015. Theranostics. 2015. PMID: 26199650 Free PMC article. Review. - Down-regulation of c-Met and Bcl2 by microRNA-206, activates apoptosis, and inhibits tumor cell proliferation, migration and colony formation.
Sun C, Liu Z, Li S, Yang C, Xue R, Xi Y, Wang L, Wang S, He Q, Huang J, Xie S, Jiang W, Li D. Sun C, et al. Oncotarget. 2015 Sep 22;6(28):25533-74. doi: 10.18632/oncotarget.4575. Oncotarget. 2015. PMID: 26325180 Free PMC article. - SMYD1 and G6PD modulation are critical events for miR-206-mediated differentiation of rhabdomyosarcoma.
Coda DM, Lingua MF, Morena D, Foglizzo V, Bersani F, Ala U, Ponzetto C, Taulli R. Coda DM, et al. Cell Cycle. 2015;14(9):1389-402. doi: 10.1080/15384101.2015.1005993. Cell Cycle. 2015. PMID: 25644430 Free PMC article. - Non-Coding RNAs Modulating Estrogen Signaling and Response to Endocrine Therapy in Breast Cancer.
Treeck O, Haerteis S, Ortmann O. Treeck O, et al. Cancers (Basel). 2023 Mar 7;15(6):1632. doi: 10.3390/cancers15061632. Cancers (Basel). 2023. PMID: 36980520 Free PMC article. Review. - How interacting pathways are regulated by miRNAs in breast cancer subtypes.
Cava C, Colaprico A, Bertoli G, Bontempi G, Mauri G, Castiglioni I. Cava C, et al. BMC Bioinformatics. 2016 Nov 8;17(Suppl 12):348. doi: 10.1186/s12859-016-1196-1. BMC Bioinformatics. 2016. PMID: 28185585 Free PMC article.
References
- Bartel DP. MicroRNAs: genomics, biogenesis, mechanism, and function. Cell 2004; 116: 281–297. - PubMed
- Calin GA, Croce CM. MicroRNA signatures in human cancers. Nat Rev Cancer 2006; 6: 857–866. - PubMed
- Ma L, Teruya-Feldstein J, Weinberg RA. Tumour invasion and metastasis initiated by microRNA-10b in breast cancer. Nature 2007; 449: 682–688. - PubMed
LinkOut - more resources
Full Text Sources
Other Literature Sources
Research Materials


