SLC30A10 is a cell surface-localized manganese efflux transporter, and parkinsonism-causing mutations block its intracellular trafficking and efflux activity - PubMed (original) (raw)
SLC30A10 is a cell surface-localized manganese efflux transporter, and parkinsonism-causing mutations block its intracellular trafficking and efflux activity
Dinorah Leyva-Illades et al. J Neurosci. 2014.
Abstract
Manganese (Mn) is an essential metal, but elevated cellular levels are toxic and may lead to the development of an irreversible parkinsonian-like syndrome that has no treatment. Mn-induced parkinsonism generally occurs as a result of exposure to elevated Mn levels in occupational or environmental settings. Additionally, patients with compromised liver function attributable to diseases, such as cirrhosis, fail to excrete Mn and may develop Mn-induced parkinsonism in the absence of exposure to elevated Mn. Recently, a new form of familial parkinsonism was reported to occur as a result of mutations in SLC30A10. The cellular function of SLC30A10 and the mechanisms by which mutations in this protein cause parkinsonism are unclear. Here, using a combination of mechanistic and functional studies in cell culture, Caenorhabditis elegans, and primary midbrain neurons, we show that SLC30A10 is a cell surface-localized Mn efflux transporter that reduces cellular Mn levels and protects against Mn-induced toxicity. Importantly, mutations in SLC30A10 that cause familial parkinsonism blocked the ability of the transporter to traffic to the cell surface and to mediate Mn efflux. Although expression of disease-causing SLC30A10 mutations were not deleterious by themselves, neurons and worms expressing these mutants exhibited enhanced sensitivity to Mn toxicity. Our results provide novel insights into the mechanisms involved in the onset of a familial form of parkinsonism and highlight the possibility of using enhanced Mn efflux as a therapeutic strategy for the potential management of Mn-induced parkinsonism, including that occurring as a result of mutations in SLC30A10.
Keywords: GPP130; SLC30A10; efflux; manganese; parkinsonism; trafficking.
Copyright © 2014 the authors 0270-6474/14/3414079-17$15.00/0.
Figures
Figure 1.
Localization of SLC30A10–WT and disease-causing mutants in HeLa cells and C. elegans. A, HeLa cells were transfected with various FLAG-tagged SLC30A10 constructs. Two days after transfection, cultures were processed for immunofluorescence. SLC30A10 was detected using a monoclonal antibody against the FLAG epitope, and a polyclonal antibody against calnexin was used to demarcate the endoplasmic reticulum. Scale bar, 10 μm. B, Quantification of percentage cells with surface-localized SLC30A10 from A (mean ± SE; n = 3 experiments with >50 cells per experiment; *p < 0.05 for the difference between SLC30A10–WT and other mutants by one-way ANOVA, followed by Tukey–Kramer _post hoc_ test). **_C_**, Quantification of the Pearson's coefficient for colocalization between SLC30A10 and calnexin from **_A_** (mean ± SE; _n_ = 15–20 cells per SLC30A10 construct; *_p_ < 0.05 for the difference between SLC30A10–WT and other mutants by one-way ANOVA, followed by Tukey–Kramer _post hoc_ test). **_D_**, HeLa cells were cotransfected with FLAG-tagged SLC30A10–WT or SLC30A10–Δ105-107 and HA-tagged DPP4. Two days after transfection, SLC30A10 was detected using an antibody against FLAG and DPP4 with an antibody against HA. Scale bar, 10 μm. **_E_**, Quantification of percentage cells from **_D_** in which signals for SLC30A10 and DPP4 overlapped (mean ± SE; _n_ = 3 experiments with >50 cells per experiment; *p < 0.05 for the difference between SLC30A10–WT and Δ105-107 by Student's t test). F, Quantification of the Pearson's coefficient for colocalization between SLC30A10 and DPP4 from D (mean ± SE; n = 17 cells per SLC30A10 construct; *p < 0.05 for the difference between SLC30A10–WT and the Δ105-107 mutant by Student's t test). G, HeLa cells were transfected with SLC30A10–WT or Δ105-107. Two days after transfection, cell surface proteins were biotinylated as described in Materials and Methods. For each transfection condition, 17% of the biotinylated elute and 10% of the unbiotinylated flow-through was loaded on a SDS-PAGE gel. Immunoblot assays were then performed to detect SLC30A10, using an anti-FLAG antibody, and GPP130. H, Quantification of the recovery of different proteins in the surface biotinylated elute from G. The signal intensity for SLC30A10–WT, SLC30A10–Δ105-107, and GPP130 in the surface biotinylated elute was calculated using NIH ImageJ. The sum of the signals was adjusted to 100, and the signal for each probe (SLC30A10–WT, SLC30A10–Δ105-107, or GPP130) was expressed as a percentage of the sum (mean ± SE; n = 3 experiments; *p < 0.05 for the difference between SLC30A10–WT and other probes by one-way ANOVA, followed by Tukey–Kramer post hoc test). I, GFP-tagged SLC30A10–WT or L89P were expressed in C. elegans under control of the unc-54 promoter. Body wall muscle cells were then imaged as described in Materials and Methods. Scale bar, 10 μm. J, GFP-tagged SLC30A10–WT or L89P were expressed in C. elegans under control of the dat-1 promoter. Localization of SLC30A10 in DAergic neurons was then assessed by microscopy. Arrowheads in the inset show surface localization of SLC30A10–WT. Scale bars: 10 μm; insets, 5 μm.
Figure 2.
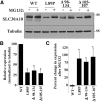
Rapid turnover of SLC30A10 mutants. A, HeLa cells were transfected with indicated FLAG-tagged SLC30A10 constructs. Two days after transfection, cultures were treated with or without 0.5 μ
m
MG132 for 24 h. Cells were then lysed, and FLAG and tubulin were detected by immunoblot. B, Quantification of SLC30A10 levels from A. Expression of SLC30A10 from cultures that were not exposed to MG132 was quantified using NIH ImageJ, and the results were normalized to tubulin expression. Normalized expression of SLC30A10–WT was set to 100 (n = 3 experiments; *p < 0.05 for the difference in expression between each SLC30A10 mutant and WT using one-way ANOVA and Dunnett's post hoc test). C, Quantification of the MG132-induced increase in expression of SLC30A10 mutants from A. SLC30A10 levels after MG132 treatment were quantified using NIH ImageJ and normalized to tubulin. Percentage increase in SLC30A10 expression was then calculated using data in B (n = 3 experiments; *p < 0.05 for the difference between SLC30A10–WT and each mutant by one-way ANOVA and Dunnett's post hoc test. MG132 treatment did not induce a statistically significant change in SLC30A10–WT levels).
Figure 3.
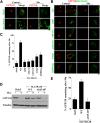
Expression of SLC30A10 blocks the Mn-induced degradation of GPP130. A, HeLa cells were transfected with plasmids coding for Rab5 (transfection control) or FLAG-tagged SLC30A10–WT. Two days after transfection, cultures were treated with or without 500 μ
m
Mn for 4 h and imaged to detect Rab5 and GPP130 or SLC30A10 (using an anti-FLAG antibody) and GPP130. Scale bar, 10 μm. B, HeLa cells were transfected with various FLAG-tagged SLC30A10 constructs. Two days after transfection, cells were treated with Mn as described in A and imaged to detect FLAG and GPP130. Scale bar, 10 μm. C, Quantification of the amount of GPP130 remaining in cells after Mn treatment from B. Mock-transfected cells did not express any SLC30A10 construct. For each transfection condition, mean GPP130 fluorescence per cell with and without Mn treatment was quantified as described in Materials and Methods and used to calculate the percentage residual GPP130 after Mn (mean ± SE; n = 22 cells per Mn treatment condition per construct; *p < 0.05 for the difference between WT and other transfection conditions by one-way ANOVA and Tukey–Kramer post hoc test). D, HeLa cells were transfected with Rab5 (transfection control), SLC30A10–WT, or SLC30A10–Δ105-107. All constructs exhibited similar transfection efficiencies. Two days after transfection, cells were treated with or without 500 μ
m
Mn for 4 h. GPP130 and tubulin were then detected by immunoblot. E, Quantification of the amount of GPP130 remaining (normalized to tubulin) after Mn treatment from D. For each transfection and Mn treatment condition, normalized GPP130 levels were quantified using NIH ImageJ and used to calculate the percentage residual GPP130 after Mn (mean ± SE; n = 3 experiments; *p < 0.05 for the difference between SLC30A10–WT and the other transfection conditions using one-way ANOVA, followed by Tukey–Kramer post hoc test).
Figure 4.
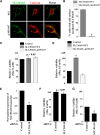
Expression of SLC30A10–WT increases Mn efflux. A, HeLa cells were transfected with a control construct (Rab5; denoted as Control) or SLC30A10–WT. Two days after transfection, cells were treated with the indicated amounts of Mn for 16 h. The absolute level of intracellular Mn was then measured using ICP-MS and normalized to total protein. Data shown are from one representative experiment; error bars depict SDs from three ICP-MS runs. Analysis from three independent experiments is presented in B. B, Quantification of the difference in intracellular Mn between cells expressing control (Rab5; Control) or SLC30A10–WT constructs from multiple experiments. HeLa cells were transfected as described in A and, 2 d after transfection, treated with 500 μ
m
Mn for 16 h. Intracellular Mn normalized to total cellular protein was then measured as described in A. In each experiment, for cells expressing the control construct, the absolute value of intracellular Mn in parts per billion per microgram protein was adjusted to 100 (mean ± SE; n = 3 experiments; *p < 0.05 by Student's t test). C, HeLa cells were transfected with the control (Rab5; Control) construct or mock transfected. Two days later, cells were treated with 500 μ
m
Mn for 16 h. Intracellular Mn in parts per billion per microgram protein was then calculated as described in A. Data are from one representative experiment; error bars depict SDs from three ICP-MS runs. Analysis from three independent experiments is presented in D below. D, Quantification of the difference in intracellular Mn between mock-transfected and control-transfected cells from multiple experiments. Cells were transfected and treated with Mn exactly as described in C. In each experiment, the value of the intracellular Mn in parts per billion per microgram protein obtained for mock-transfected cells was adjusted to 100 (mean ± SE; n = 3 experiments; p > 0.05 for the difference between the two groups by Student's t test). E, HeLa cells were transfected with control (Rab5; Control), SLC30A10–WT, or SLC30A10–Δ105-107 constructs. Two days after transfection, the Mn pulse-chase assay was performed as described in Materials and Methods. After the chase, intracellular Mn retained within the cells and released into the medium was measured using ICP-MS. For each transfection condition, the amount of Mn in each compartment (intracellular or extracellular) was expressed as a percentage of the total Mn (i.e., sum of the intracellular and extracellular Mn). As in A, data shown are from one representative experiment; error bars depict SDs from three ICP-MS runs. Analysis from three independent experiments is presented in F. F, Quantification of the difference in intracellular Mn after the pulse-chase assay from multiple experiments. The Mn pulse-chase assay was performed in HeLa cells expressing control (Rab5; Control), SLC30A10–WT, or SLC30A10–Δ105-107 constructs exactly as described in E. In each experiment, for control-transfected cells, the percentage intracellular Mn retained was adjusted to 50 (mean ± SE; n = 3 experiments; *p < 0.05 for the difference between WT and other transfection conditions by one-way ANOVA and Tukey–Kramer post hoc test). G, HeLa cells were transfected with the control Rab5 construct or SLC30A10–WT. Two days after transfection, cells were treated with 100 μ
m
Zn for 16 h. The absolute level of intracellular Zn was then measured using ICP-MS and normalized to total protein. Data shown are from one representative experiment; error bars depict SDs from three ICP-MS runs. Analysis from three independent experiments is presented in H. H, Quantification of the difference in intracellular Zn between cells expressing control (Rab5) or SLC30A10–WT constructs from multiple experiments. Intracellular Zn levels were measured exactly as described in G. In each experiment, for cells expressing the control construct, the absolute value for intracellular Zn (parts per billion per microgram protein) was adjusted to 100 (mean ± SE; n = 3 experiments; p > 0.05 by Student's t test). In this panel, the SE is relatively high because, over multiple experiments, the difference in intracellular Zn levels between control and SLC30A10-transfected cells had a wide distribution. I, Two days after transfection, HeLa cells expressing the control Rab5 construct or SLC30A10–WT were treated with 100 μ
m
Cu for 16 h. After this, intracellular Cu was measured using ICP-MS. Values were normalized to total protein. Data shown are from one representative experiment; error bars depict SDs from three ICP-MS runs. Analysis from three independent experiments is presented in J. J, Quantification of the difference in intracellular Cu between cells expressing control (Rab5) or SLC30A10–WT constructs from multiple experiments. Intracellular Cu was measured as described in I. In each experiment, for cells expressing the control construct, the absolute value for intracellular Cu (parts per billion per microgram protein) was adjusted to 100 (mean ± SE; n = 3 experiments; p > 0.05 by Student's t test).
Figure 5.
SLC30A10–WT protects against Mn toxicity. A, HeLa cells were transfected with a control construct (Rab5; Control) or SLC30A10–WT. Two days after transfection, cells were treated with 0, 1, or 2 m
m
Mn for 16 h. Cell viability was then assessed using the MTT assay as described in Materials and Methods. For each transfection condition, viability at 0 m
m
Mn was set to 100 and used to calculate the percentage viability after Mn treatment (mean ± SE; n = 3 experiments; *p < 0.05 for the difference between the viability of control and SLC30A10–WT-expressing cells at each Mn treatment condition; comparison between groups was performed at each Mn treatment condition separately using Student's t test). B, HeLa cells, transfected with the control (Rab5; Control), SLC30A10–WT, or SLC30A10–Δ105-107 constructs as described in A, were treated with 0 or 2 m
m
Mn for 16 h. The MTT assay was then performed to assess cell viability. For each experiment, percentage viability of the transfection control cells that were treated with Mn was set to 50 and used for normalization of the viability of Mn-treated cells from SLC30A10–WT and Δ105-107 groups (mean ± SE; n = 3 experiments; *p < 0.05 for the difference in viability between SLC30A10–WT and other transfection groups using one-way ANOVA, followed by Tukey–Kramer post hoc test). C, HeLa cells were transfected with the control Rab5 construct or mock transfected. Two days after transfection, cells were treated with 0 or 2 m
m
Mn for 16 h. For each experiment, percentage viability of the mock-transfected cells that were treated with Mn was set to 50 and used for normalization of the viability of Mn-treated SLC30A10–WT-expressing cells (mean ± SE; n = 3 experiments; p > 0.05 by Student's t test). D, E, HeLa cells were transfected with the control Rab5 construct or SLC30A10–WT. Two days later, cells were treated with 0 or 2 m
m
Zn (D) or 0 or 2 m
m
Cu (E). For each metal in each experiment, percentage viability for mock-transfected cells after metal treatment was adjusted to 50 and used for normalization of the viability of metal-treated SLC30A10–WT-expressing cells (for each panel, mean ± SE; n = 3 experiments; p > 0.05 by Student's t test).
Figure 6.
Confirmation of SLC30A10 expression by semiquantitative RT-PCR. Primers used to detect SLC30A10 are described in Materials and Methods.
Figure 7.
SLC30A10 protects C. elegans against Mn toxicity. A–C, Control worms that were transfected with a mixture lacking SLC30A10 plasmids or worms transfected with SLC30A10–WT or L89P were synchronized in the L1 stage and grown to L4 stage. Worms were then exposed to 0, 100, or 200 m
m
Mn for 1 h. Viability was subsequently assessed as described in Materials and Methods (mean ± SE; n = 3 experiments with ∼30 worms per Mn treatment condition, per genotype, per experiment; *p < 0.05 and **p < 0.01 for the difference between control and other transfection conditions by one-way ANOVA, followed by Tukey–Kramer post hoc test).
Figure 8.
SLC30A10 protects DAergic neurons from neurodegeneration induced by Mn exposure. A–E, Worms expressing dat-1::GFP were synchronized in the L1 stage and treated with 0 m
m
Mn (A) or 10 m
m
Mn for 1 h (B–E). DAergic neurons were then imaged as described in Materials and Methods. In B–E, arrowheads indicate degeneration in neuronal processes, and asterisks indicate degeneration in cell bodies. Scale bars, 10 μm. F–H, Worms expressing dat-1::GFP only (control) or dat-1::GFP along with dat-1::SLC30A10–WT or L89P were grown, treated with 0, 10, or 25 m
m
Mn, and imaged as described above. For each genotype, the number of worms in which DAergic neurons were “intact” (i.e., did not show any evidence of neurodegeneration) was calculated as described in Materials and Methods (mean ± SE; n = 3 experiments with at least 20 worms per Mn treatment condition, per genotype, per experiment; *p < 0.05, **p < 0.01, and ***p < 0.001 for the difference between control and other transfection conditions by one-way ANOVA, followed by Tukey–Kramer post hoc test).
Figure 9.
SLC30A10 improves basal slowing response in C. elegans during Mn exposure. A, The basal slowing response was assayed in control worms that expressed dat1::GFP as described in Materials and Methods (mean ± SE; n = 3 experiments with 5–10 worms per Mn treatment condition, per experiment. ****p < 0.0001 by Student's t test). B–D, Worms transfected with dat1::GFP (control) or those transfected with dat1::GFP and dat-1::SLC30A10–WT or L89P were synchronized at the L1 stage and then exposed to 0, 10, or 25 m
m
Mn for 1 h. Worms were kept on NGM plates for recovery. The next day, the basal slowing response was measured (mean ± SE; n = 3 experiments with 5–10 worms per Mn treatment condition, per experiment, per genotype; *p < 0.05 and ****p < 0.0001 by one-way ANOVA, followed by Tukey–Kramer post hoc test).
Figure 10.
SLC30A10 mediates Mn detoxification in GABAergic AF5 cells. A, AF5 cells were transfected with FLAG-tagged SLC30A10–WT or Δ105-107 constructs. One day after transfection, cultures were differentiated as described in Materials and Methods. Cells were then imaged to detect FLAG and calnexin. Scale bar, 10 μm. B, Quantification of percentage cells with surface localized SLC30A10 from A (mean ± SE; n = 3 experiments with >50 cells per experiment; *p < 0.05 for the difference between SLC30A10–WT and Δ105-107 by Student's _t_ test). **_C_**, AF5 cells were transfected with control (Rab5; Control), SLC30A10–WT, or Δ105-107 constructs. One day after transfection, cultures were transferred to differentiation medium for 48 h. Viability was then assessed using the MTT assay. Viability of cells expressing the control construct was set to 100 and used for normalization of viability of other transfection conditions (mean ± SE; _n_ = 3 experiments; _p_ > 0.05 by one-way ANOVA). D, AF5 cells were transfected with the control Rab5, SLC30A10–WT, or Δ105-107 constructs. One day after transfection, cultures were shifted to differentiation medium for 32 h. After this, cultures were treated with 0 or 500 μ
m
Mn for 16 h in differentiation media. At the end of the Mn treatment, cell viability was assessed using the MTT assay. Percentage viability of the transfection control cells that were treated with Mn was set to 50 and used for normalization of the viability of Mn-treated cells from SLC30A10–WT and SLC30A10–Δ105-107 groups (mean ± SE; n = 3 experiments; *p < 0.05 for the difference between SLC30A10–WT and other transfection conditions by one-way ANOVA, followed by Tukey–Kramer _post hoc_ test). **_E_**, AF5 cells were transfected with control or anti-SLC30A10 siRNAs. One day after transfection, cultures were transferred to differentiation medium. After 48 h of differentiation (i.e., 72 h after knockdown), cells were harvested for real-time analyses. RNA isolation and generation of cDNA was performed as described in Materials and Methods. mRNA levels of SLC30A10 and a housekeeping gene, GAPDH, were then quantified using real-time RT-PCR. For each transfection condition, level of SLC30A10 mRNA was normalized to that of GAPDH to correct for generalized changes in gene expression. Normalized levels of SLC30A10 mRNA of the control siRNA group was then expressed as 1 (mean ± SE; _n_ = 3 experiments; *_p_ < 0.05 by Student's _t_ test). **_F_**, AF5 cells were transfected with the control or anti-SLC30A10 siRNAs and, 1 d after transfection, shifted to differentiation media for 48 h as above. After this, cell viability was assessed using the MTT assay (mean ± SE; _n_ = 3 experiments; _p_ > 0.05 by Student's t test). G, AF5 cells, transfected with the control or anti-SLC30A10 siRNA, were shifted to differentiation media 1 d after knockdown. Cells were kept in differentiation medium for 32 h. After this, cells were treated with 0 or 500 μ
m
Mn for an additional 16 h in differentiation media. Percentage viability of the Mn-treated transfection control cells was expressed as 50 and used for normalization of the viability of Mn-treated cells from the anti-SLC30A10 siRNA group (mean ± SE; n = 3 experiments; *p < 0.05 by Student's t test).
Figure 11.
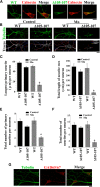
SLC30A10 protects primary midbrain neurons from Mn-induced neurodegeneration. A, Primary midbrain neurons were generated as described in Materials and Methods. Four days after plating, cultures were transfected with FLAG-tagged SLC30A10–WT or Δ105-107. Two days after transfection, cultures were fixed and stained to detect FLAG using a monoclonal antibody and calnexin using a polyclonal antibody. FLAG expression in the cell body appeared to be stronger than in neurites. Scale bar, 10 μm. B, Primary midbrain neurons were generated and transfected with FLAG-tagged SLC30A10 constructs as described above. One day after transfection, cultures were treated with 0 (Control) or 200 μ
m
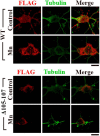
Mn for 16 h. Cultures were then fixed and stained using a monoclonal antibody against tubulin to visualize neurites and a polyclonal antibody against FLAG to detect transfection. Expression of the FLAG-tagged SLC30A10 constructs in the cells depicted in this panel is shown in Figure 12. For the bottom row, the tubulin images were converted to grayscale, and primary (red), secondary (blue), and tertiary (yellow) neurites that emanated from the neurons were drawn using the NeuronJ plugin of NIH ImageJ. Scale bar, 10 μm. C–F, Quantification of the morphology of neurites from B above. For each neuron, the length of the longest primary neurite, total length of the neuritic tree, total number of primary neurites, and total number of neurites were calculated using the NeuronJ plugin of NIH ImageJ (for each parameter measured, n = 15–25 neurons for each transfection and Mn treatment condition; *p < 0.05 for the difference between Mn-treated cells expressing SLC30A10–Δ105-107 and the other transfection and Mn treatment conditions using one-way ANOVA, followed by Tukey–Kramer post hoc test). G, Primary midbrain neurons were generated as described above and stained to detect tubulin using a monoclonal antibody and GAD 65/67 using a polyclonal antibody. Scale bar, 10 μm.
Figure 12.
Presence of FLAG-tagged SLC30A10 constructs in neurons depicted in Figure 11. Cells shown in this figure are identical to those shown in Figure 11_B_. FLAG expression was stronger in the cell body compared with neurites. Note that the polyclonal anti-FLAG antibody used here was very specific and sensitive in identifying transfected cells but was not as effective as the monoclonal anti-FLAG antibody used in Figure 11_A_ for determining intracellular FLAG localization. Use of the polyclonal FLAG antibody was essential because the monoclonal FLAG and tubulin antibodies were from the same species. Scale bars, 10 μm.
Similar articles
- SLC30A10 Mutation Involved in Parkinsonism Results in Manganese Accumulation within Nanovesicles of the Golgi Apparatus.
Carmona A, Zogzas CE, Roudeau S, Porcaro F, Garrevoet J, Spiers KM, Salomé M, Cloetens P, Mukhopadhyay S, Ortega R. Carmona A, et al. ACS Chem Neurosci. 2019 Jan 16;10(1):599-609. doi: 10.1021/acschemneuro.8b00451. Epub 2018 Oct 15. ACS Chem Neurosci. 2019. PMID: 30272946 Free PMC article. - Manganese efflux in Parkinsonism: insights from newly characterized SLC30A10 mutations.
DeWitt MR, Chen P, Aschner M. DeWitt MR, et al. Biochem Biophys Res Commun. 2013 Mar 1;432(1):1-4. doi: 10.1016/j.bbrc.2013.01.058. Epub 2013 Jan 26. Biochem Biophys Res Commun. 2013. PMID: 23357421 Free PMC article. - Structural Elements in the Transmembrane and Cytoplasmic Domains of the Metal Transporter SLC30A10 Are Required for Its Manganese Efflux Activity.
Zogzas CE, Aschner M, Mukhopadhyay S. Zogzas CE, et al. J Biol Chem. 2016 Jul 29;291(31):15940-57. doi: 10.1074/jbc.M116.726935. Epub 2016 Jun 15. J Biol Chem. 2016. PMID: 27307044 Free PMC article. - Familial manganese-induced neurotoxicity due to mutations in SLC30A10 or SLC39A14.
Mukhopadhyay S. Mukhopadhyay S. Neurotoxicology. 2018 Jan;64:278-283. doi: 10.1016/j.neuro.2017.07.030. Epub 2017 Aug 5. Neurotoxicology. 2018. PMID: 28789954 Free PMC article. Review. - Role of excretion in manganese homeostasis and neurotoxicity: a historical perspective.
Gurol KC, Aschner M, Smith DR, Mukhopadhyay S. Gurol KC, et al. Am J Physiol Gastrointest Liver Physiol. 2022 Jan 1;322(1):G79-G92. doi: 10.1152/ajpgi.00299.2021. Epub 2021 Nov 17. Am J Physiol Gastrointest Liver Physiol. 2022. PMID: 34786983 Free PMC article. Review.
Cited by
- Genetics and Epigenetics of Manganese Toxicity.
Lindner S, Lucchini R, Broberg K. Lindner S, et al. Curr Environ Health Rep. 2022 Dec;9(4):697-713. doi: 10.1007/s40572-022-00384-2. Epub 2022 Nov 10. Curr Environ Health Rep. 2022. PMID: 36357556 Free PMC article. Review. - Role of Astrocytes in Manganese Neurotoxicity Revisited.
Ke T, Sidoryk-Wegrzynowicz M, Pajarillo E, Rizor A, Soares FAA, Lee E, Aschner M. Ke T, et al. Neurochem Res. 2019 Nov;44(11):2449-2459. doi: 10.1007/s11064-019-02881-7. Epub 2019 Sep 30. Neurochem Res. 2019. PMID: 31571097 Free PMC article. Review. - Small Molecule Modifiers of In Vitro Manganese Transport Alter Toxicity In Vivo.
Peres TV, Horning KJ, Bornhorst J, Schwerdtle T, Bowman AB, Aschner M. Peres TV, et al. Biol Trace Elem Res. 2019 Mar;188(1):127-134. doi: 10.1007/s12011-018-1531-7. Epub 2018 Sep 28. Biol Trace Elem Res. 2019. PMID: 30267310 Free PMC article. - Analysis of genetic networks regulating refractive eye development in collaborative cross progenitor strain mice reveals new genes and pathways underlying human myopia.
Tkatchenko TV, Shah RL, Nagasaki T, Tkatchenko AV. Tkatchenko TV, et al. BMC Med Genomics. 2019 Jul 30;12(1):113. doi: 10.1186/s12920-019-0560-1. BMC Med Genomics. 2019. PMID: 31362747 Free PMC article. - Genetic Disorders Associated with Metal Metabolism.
Umair M, Alfadhel M. Umair M, et al. Cells. 2019 Dec 9;8(12):1598. doi: 10.3390/cells8121598. Cells. 2019. PMID: 31835360 Free PMC article. Review.
References
- Benedetto A, Au C, Avila DS, Milatovic D, Aschner M. Extracellular dopamine potentiates Mn-induced oxidative stress, lifespan reduction, and dopaminergic neurodegeneration in a BLI-3-dependent manner in Caenorhabditis elegans. PLoS Genet. 2010;6:e1001084. doi: 10.1371/journal.pgen.1001084. - DOI - PMC - PubMed
Publication types
MeSH terms
Substances
Grants and funding
- R00 ES020844/ES/NIEHS NIH HHS/United States
- R00-ES020488/ES/NIEHS NIH HHS/United States
- R01 ES020488/ES/NIEHS NIH HHS/United States
- R01-ES010563/ES/NIEHS NIH HHS/United States
- U01 AA016651/AA/NIAAA NIH HHS/United States
- R01 ES007331/ES/NIEHS NIH HHS/United States
- R01 ES010563/ES/NIEHS NIH HHS/United States
LinkOut - more resources
Full Text Sources
Other Literature Sources
Medical
Molecular Biology Databases
Research Materials

