Using observation-level random effects to model overdispersion in count data in ecology and evolution - PubMed (original) (raw)
Using observation-level random effects to model overdispersion in count data in ecology and evolution
Xavier A Harrison. PeerJ. 2014.
Abstract
Overdispersion is common in models of count data in ecology and evolutionary biology, and can occur due to missing covariates, non-independent (aggregated) data, or an excess frequency of zeroes (zero-inflation). Accounting for overdispersion in such models is vital, as failing to do so can lead to biased parameter estimates, and false conclusions regarding hypotheses of interest. Observation-level random effects (OLRE), where each data point receives a unique level of a random effect that models the extra-Poisson variation present in the data, are commonly employed to cope with overdispersion in count data. However studies investigating the efficacy of observation-level random effects as a means to deal with overdispersion are scarce. Here I use simulations to show that in cases where overdispersion is caused by random extra-Poisson noise, or aggregation in the count data, observation-level random effects yield more accurate parameter estimates compared to when overdispersion is simply ignored. Conversely, OLRE fail to reduce bias in zero-inflated data, and in some cases increase bias at high levels of overdispersion. There was a positive relationship between the magnitude of overdispersion and the degree of bias in parameter estimates. Critically, the simulations reveal that failing to account for overdispersion in mixed models can erroneously inflate measures of explained variance (r (2)), which may lead to researchers overestimating the predictive power of variables of interest. This work suggests use of observation-level random effects provides a simple and robust means to account for overdispersion in count data, but also that their ability to minimise bias is not uniform across all types of overdispersion and must be applied judiciously.
Keywords: Explained variance; Generalized linear mixed models; Observation-level random effect; Poisson-lognormal models; Quasi-Poisson; r-squared.
Figures
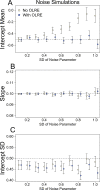
Figure 1. Model parameters for the intercept mean (A), slope of the effect of body size (B) and intercept standard deviation (C) generated under various levels of overdispersion for the noise simulations.
Light circles represent the mean values of the Naive models, where overdispersion was ignored. Blue circles represent the models containing observation-level random effects. Error bars are 95% confidence intervals of the mean as estimated by bootstrapping. Dashed horizontal lines denote the true (simulated) parameter values.
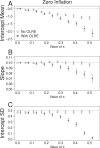
Figure 2. Parameters for the intercept mean (A), slope of the effect of body size (B) and intercept standard deviation (C) generated under various levels of overdispersion for the Zero-Inflation simulations.
Light circles represent the mean values of the Naive models, where overdispersion was ignored. Blue circles represent the models containing observation-level random effects. Error bars are 95% confidence intervals of the mean as estimated by bootstrapping. Dashed horizontal lines denote the true (simulated) parameter values.
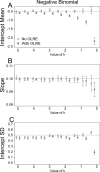
Figure 3. Parameters for the intercept mean (A), slope of the effect of body size (B) and intercept standard deviation (C) generated under various levels of overdispersion for the negative binomial simulations.
Light circles represent the mean values of the Naive models, where overdispersion was ignored. Blue circles represent the models containing observation-level random effects. Error bars are 95% confidence intervals of the mean as estimated by bootstrapping. Dashed horizontal lines denote the true (simulated) parameter values.
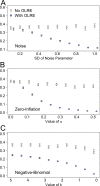
Figure 4. Marginal _r_2 values of models generated under 3 scenarios of overdispersion: (A) extra-Poisson noise; (B) zero-inflated data; and (C) data generated from a negative binomial distribution.
Moving from left to right on the x axes corresponds to increasing levels of overdispersion in the models. Light circles represent the mean values of the Naive models, where overdispersion was ignored. Blue circles represent the models containing observation-level random effects. Error bars are 95% confidence intervals of the mean as estimated by bootstrapping. Ignoring overdispersion under all three scenarios resulted in greatly inflated estimates of the proportion of explained variance relative to where overdispersion was taken into account.
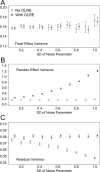
Figure 5. The three components of variance used to calculate the _r_2 metrics proposed by Nakagawa & Schielzeth (2013) for the noise simulation datasets at various levels of overdispersion.
Light circles represent the mean values of the Naive models, where overdispersion was ignored. Blue circles represent the models containing observation-level random effects. Error bars are 95% confidence intervals of the mean as estimated by bootstrapping.
Similar articles
- A comparison of observation-level random effect and Beta-Binomial models for modelling overdispersion in Binomial data in ecology & evolution.
Harrison XA. Harrison XA. PeerJ. 2015 Jul 21;3:e1114. doi: 10.7717/peerj.1114. eCollection 2015. PeerJ. 2015. PMID: 26244118 Free PMC article. - Marginalized multilevel hurdle and zero-inflated models for overdispersed and correlated count data with excess zeros.
Kassahun W, Neyens T, Molenberghs G, Faes C, Verbeke G. Kassahun W, et al. Stat Med. 2014 Nov 10;33(25):4402-19. doi: 10.1002/sim.6237. Epub 2014 Jun 23. Stat Med. 2014. PMID: 24957791 - Comparative assessment of parameter estimation methods in the presence of overdispersion: a simulation study.
Roosa K, Luo R, Chowell G. Roosa K, et al. Math Biosci Eng. 2019 May 16;16(5):4299-4313. doi: 10.3934/mbe.2019214. Math Biosci Eng. 2019. PMID: 31499663 - Distribution-free models for longitudinal count responses with overdispersion and structural zeros.
Yu Q, Chen R, Tang W, He H, Gallop R, Crits-Christoph P, Hu J, Tu XM. Yu Q, et al. Stat Med. 2013 Jun 30;32(14):2390-405. doi: 10.1002/sim.5691. Epub 2012 Dec 12. Stat Med. 2013. PMID: 23239019 Free PMC article. Review. - Revisiting the analysis pipeline for overdispersed Poisson and binomial data.
Lee W, Kim J, Lee D. Lee W, et al. J Appl Stat. 2022 Jan 20;50(7):1455-1476. doi: 10.1080/02664763.2022.2026897. eCollection 2023. J Appl Stat. 2022. PMID: 37197756 Free PMC article. Review.
Cited by
- No net effect of host density on tick-borne disease hazard due to opposing roles of vector amplification and pathogen dilution.
Gandy S, Kilbride E, Biek R, Millins C, Gilbert L. Gandy S, et al. Ecol Evol. 2022 Sep 6;12(9):e9253. doi: 10.1002/ece3.9253. eCollection 2022 Sep. Ecol Evol. 2022. PMID: 36091342 Free PMC article. - Eunuchs or Females? Causes and Consequences of Gynodioecy on Morphology, Ploidy, and Ecology of Stellaria graminea L. (Caryophyllaceae).
Kučera J, Svitok M, Gbúrová Štubňová E, Mártonfiová L, Lafon Placette C, Slovák M. Kučera J, et al. Front Plant Sci. 2021 Apr 12;12:589093. doi: 10.3389/fpls.2021.589093. eCollection 2021. Front Plant Sci. 2021. PMID: 33912199 Free PMC article. - Cognitive ability is heritable and predicts the success of an alternative mating tactic.
Smith C, Philips A, Reichard M. Smith C, et al. Proc Biol Sci. 2015 Jun 22;282(1809):20151046. doi: 10.1098/rspb.2015.1046. Proc Biol Sci. 2015. PMID: 26041347 Free PMC article. - Meaningful call combinations and compositional processing in the southern pied babbler.
Engesser S, Ridley AR, Townsend SW. Engesser S, et al. Proc Natl Acad Sci U S A. 2016 May 24;113(21):5976-81. doi: 10.1073/pnas.1600970113. Epub 2016 May 6. Proc Natl Acad Sci U S A. 2016. PMID: 27155011 Free PMC article. - Exotic garden plants partly substitute for native plants as resources for pollinators when native plants become seasonally scarce.
Staab M, Pereira-Peixoto MH, Klein AM. Staab M, et al. Oecologia. 2020 Nov;194(3):465-480. doi: 10.1007/s00442-020-04785-8. Epub 2020 Oct 20. Oecologia. 2020. PMID: 33079266 Free PMC article.
References
- Bates D, Maechler M, Bolker B, Walker S. lme4: linear mixed-effects models using Eigen and S4. (R package version 1.1-6) 2014 Available at http://CRAN.R-project.org/package=lme4 .
- Crawley MJ. The R book. United Kingdom: John Wiley & Sons Ltd; 2007.
- Fournier DA, Skaug HJ, Ancheta J, Ianelli J, Magnusson A, Maunder M, Nielsen A, Sibert J. AD Model Builder: using automatic differentiation for statistical inference of highly parameterised complex non-linear models. Optimisation Methods & Software. 2012;27:233–249. doi: 10.1080/10556788.2011.597854. - DOI
LinkOut - more resources
Full Text Sources
Other Literature Sources
