Magnetic particle imaging with tailored iron oxide nanoparticle tracers - PubMed (original) (raw)
. 2015 May;34(5):1077-84.
doi: 10.1109/TMI.2014.2375065. Epub 2014 Nov 25.
Amit P Khandhar, Scott J Kemp, Hamed Arami, Emine U Saritas, Laura R Croft, Justin Konkle, Patrick W Goodwill, Aleksi Halkola, Jurgen Rahmer, Jorn Borgert, Steven M Conolly, Kannan M Krishnan
- PMID: 25438306
- PMCID: PMC4428902
- DOI: 10.1109/TMI.2014.2375065
Magnetic particle imaging with tailored iron oxide nanoparticle tracers
R Matthew Ferguson et al. IEEE Trans Med Imaging. 2015 May.
Abstract
Magnetic particle imaging (MPI) shows promise for medical imaging, particularly in angiography of patients with chronic kidney disease. As the first biomedical imaging technique that truly depends on nanoscale materials properties, MPI requires highly optimized magnetic nanoparticle tracers to generate quality images. Until now, researchers have relied on tracers optimized for MRI T2(∗) -weighted imaging that are sub-optimal for MPI. Here, we describe new tracers tailored to MPI's unique physics, synthesized using an organic-phase process and functionalized to ensure biocompatibility and adequate in vivo circulation time. Tailored tracers showed up to 3 × greater signal-to-noise ratio and better spatial resolution than existing commercial tracers in MPI images of phantoms.
Figures
Figure 1
Schematic illustration of MPI detection and size-dependent tracer magnetic properties. (a) The characteristic nonlinear magnetic response (m(t) and its derivative _m_’(t)) of superparamagnetic nanoparticles to an applied field, H. (b, c) As the field free point sweeps over a location that contains MNPs, _b_’(t) changes rapidly, generating a signal that reveals the MNP location. In (b) and (c), _m_’′(t) (black curve) is shown for all time t< tn, while the FFP, which is moving from left to right with time, is represented at t = tn, where n = 1 or 2. MPS signals: (d) _m_’(H), the tracer response, determines the point spread function (PSF, _m_’(Gx)) when the system field gradient, G, is known; (e) the harmonic spectrum, F(_m_’), is used to evaluate tracers for System Matrix MPI reconstruction.
Figure 2
MNP size characterization of LS-1. (a) Bright field TEM image of magnetite particles. In this example, median crystal diameter was determined to be 26 nm from statistical analysis of TEM images (6000 particle counts), assuming a log-normal distribution. (b) Median magnetic core diameter was determined to be 28 nm by fitting M(H) data to the Langevin function and assuming a log-normal size distribution. (c) Hydrodynamic diameter (~72 nm, Z-average) was measured using dynamic light scattering.
Figure 3
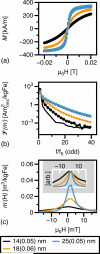
MNP magnetic properties. (a) Measured M(H) loops for water-suspended MNPs of the specified median diameter and distribution width, σ. (b) Measured harmonic spectra, showing only odd harmonics. The system noise floor is also shown (solid line). (c) Measured tracer response, scaled by iron content and normalized to 1 for comparison of FWHM (inset). Only scans of increasing H are shown in the figure.
Figure 4
MPI performance is determined largely by MNP core size and size distribution. Here, key performance metrics measured by MPS are presented for different tracer formulations produced during optimization, with both spot size and color proportional to the relevant metric: (a) Spatial resolution (FWHM of tracer response, in mT/μ0, smallest diameter is best) and (b) Normalized intensity (max intensity of tracer response, in m3/kgFe, largest diameter is best). According to both metrics, MPI performance improves with increasing core size, provided that size distribution remains narrow.
Figure 5
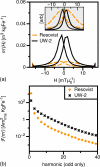
MPS measurements (f0 = 25kHz, Hmax = 16 mT/μ0) of optimized MNPs (UW-2) and _Resovist_®: (a) MNP response, _m_’′(H). Forward (low to high field) and reverse (high to low field) scans are shown. Signal intensity, measured by the _m_’(H) maximum, of UW-2 was 0.030 m3/kgFe, 6x greater than Resovist® (0.005 m3/kgFe). Full width at half maximum resolution was 4.7 (mT/μ0) for UW-2, half that of _Resovist_®. (b) Harmonic spectra of UW-2 and _Resovist_®. UW-2 showed greater harmonic intensity for all harmonics; 3.5x, 12.1x, and 9.8x greater at the 3rd, 19th, 39th harmonics, respectively.
Figure 6
Fast system matrix MPI imaging of phantoms containing equivalent iron concentrations of UW-2 (b, top) and _Resovist_® (b, bottom), acquired with Philips pre-clinical demonstrator imaging system. Acquisition time was 0.129 s, with an additional 0.431 s of latency built into the acquisition sequence. (a) photograph of phantom filled with tracer. Tubing inner diameter was 1.5 mm. (b) Comparison of reconstructed MPI images, after scaling intensities with the noise levels of the images. (c) Intensity profiles obtained from phantom images.
Figure 7
x-space phantom imaging experiments at the UC Berkeley 3D MPI scanner. (a) Native (i.e., undeconvolved) MPI images of the phantoms. Channels were 1.5 mm wide and 1.5 mm deep. (b) MPI images of the phantoms, where UW-1 shows improved signal intensity and spatial resolution. Images are maximum intensity projections after mild Weiner deconvolution, with absolute intensity scaling. The imaging FOV was 4.5 × 4.5 × 14 cm3. (c) Photograph of laser-cut acrylic phantoms containing UW-1 (top) and _Resovist_® (bottom) (top) mid-line cross-sections (bottom) of native
Figure 8
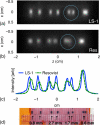
Resolution phantoms. Native MPI images (maximum intensity projections) of phantoms containing LS-1 (a) and Resovist (b); blue circles were overlaid for emphasis (c) cross sections. (d) photograph of the LS-1 phantom. Edge to edge separation between adjacent point sources (0.56 mm diameter) was 3.8, 2.7, 1.7, and 0.6 mm, respectively.
Similar articles
- In vivo multimodal magnetic particle imaging (MPI) with tailored magneto/optical contrast agents.
Arami H, Khandhar AP, Tomitaka A, Yu E, Goodwill PW, Conolly SM, Krishnan KM. Arami H, et al. Biomaterials. 2015 Jun;52:251-61. doi: 10.1016/j.biomaterials.2015.02.040. Epub 2015 Feb 28. Biomaterials. 2015. PMID: 25818431 Free PMC article. - Tailoring the magnetic and pharmacokinetic properties of iron oxide magnetic particle imaging tracers.
Ferguson RM, Khandhar AP, Arami H, Hua L, Hovorka O, Krishnan KM. Ferguson RM, et al. Biomed Tech (Berl). 2013 Dec;58(6):493-507. doi: 10.1515/bmt-2012-0058. Biomed Tech (Berl). 2013. PMID: 23787461 Free PMC article. Review. - Magnetic Particle Imaging Tracers: State-of-the-Art and Future Directions.
Bauer LM, Situ SF, Griswold MA, Samia AC. Bauer LM, et al. J Phys Chem Lett. 2015 Jul 2;6(13):2509-17. doi: 10.1021/acs.jpclett.5b00610. Epub 2015 Jun 17. J Phys Chem Lett. 2015. PMID: 26266727 - In vitro and in vivo comparison of a tailored magnetic particle imaging blood pool tracer with Resovist.
Kaul MG, Mummert T, Jung C, Salamon J, Khandhar AP, Ferguson RM, Kemp SJ, Ittrich H, Krishnan KM, Adam G, Knopp T. Kaul MG, et al. Phys Med Biol. 2017 May 7;62(9):3454-3469. doi: 10.1088/1361-6560/aa5780. Epub 2017 Jan 6. Phys Med Biol. 2017. PMID: 28060771 - Magnetic nanoparticles for magnetic particle imaging (MPI): design and applications.
Rezaei B, Tay ZW, Mostufa S, Manzari ON, Azizi E, Ciannella S, Moni HE, Li C, Zeng M, Gómez-Pastora J, Wu K. Rezaei B, et al. Nanoscale. 2024 Jun 27;16(25):11802-11824. doi: 10.1039/d4nr01195c. Nanoscale. 2024. PMID: 38809214 Review.
Cited by
- Highly sensitive magnetic particle imaging of abdominal aortic aneurysm NETosis with anti-Ly6G iron oxide nanoparticles.
Wang H, Zhang R, Jia X, Gao S, Gao T, Fan K, Li Y, Wang S, Qiao M, Yan S, Hui H, Dong H. Wang H, et al. Cell Death Discov. 2024 Sep 5;10(1):395. doi: 10.1038/s41420-024-02156-3. Cell Death Discov. 2024. PMID: 39237520 Free PMC article. - A High-Throughput, Arbitrary-Waveform, MPI Spectrometer and Relaxometer for Comprehensive Magnetic Particle Optimization and Characterization.
Tay ZW, Goodwill PW, Hensley DW, Taylor LA, Zheng B, Conolly SM. Tay ZW, et al. Sci Rep. 2016 Sep 30;6:34180. doi: 10.1038/srep34180. Sci Rep. 2016. PMID: 27686629 Free PMC article. - Continuously manufactured single-core iron oxide nanoparticles for cancer theranostics as valuable contribution in translational research.
Bleul R, Baki A, Freese C, Paysen H, Kosch O, Wiekhorst F. Bleul R, et al. Nanoscale Adv. 2020 Aug 17;2(10):4510-4521. doi: 10.1039/d0na00343c. eCollection 2020 Oct 13. Nanoscale Adv. 2020. PMID: 36132895 Free PMC article. - Gram scale synthesis of magnetite nanoparticles optimized for single-core MPI tracers.
Kemp SJ, Ferguson RM, Khandhar AP, Krishnan KM. Kemp SJ, et al. Int Workshop Magn Part Imaging. 2015 Mar;2015:10.1109/IWMPI.2015.7107016. doi: 10.1109/IWMPI.2015.7107016. Int Workshop Magn Part Imaging. 2015. PMID: 26636133 Free PMC article. No abstract available. - Efficient hybrid 3D system calibration for magnetic particle imaging systems using a dedicated device.
von Gladiss A, Graeser M, Behrends A, Chen X, Buzug TM. von Gladiss A, et al. Sci Rep. 2020 Oct 28;10(1):18432. doi: 10.1038/s41598-020-75122-5. Sci Rep. 2020. PMID: 33116183 Free PMC article.
References
- Gleich B, Weizenecker J. Tomographic imaging using the nonlinear response of magnetic particles. Nature. 2005 Jul;435(7046):1214–1217. - PubMed
- Goodwill PW, Saritas EU, Croft LR, Kim TN, Krishnan KM, Schaffer DV, Conolly SM. X-Space MPI: Magnetic Nanoparticles for Safe Medical Imaging. Advanced Materials. 2012;24:3870–3877. - PubMed
- Weizenecker J, Gleich B, Rahmer J, Dahnke H, Borgert J. Three-dimensional real-time in vivo magnetic particle imaging. Phys. Med. Biol. 2009;54(5):L1–L10. - PubMed
- Weizenecker J, Borgert J, Gleich B. A simulation study on the resolution and sensitivity of magnetic particle imaging. Phys. Med. Biol. 2007;52:6363–6374. - PubMed
Publication types
MeSH terms
Substances
Grants and funding
- R42 EB013520/EB/NIBIB NIH HHS/United States
- 2R42EB013520-02A1/EB/NIBIB NIH HHS/United States
- R41 EB013520/EB/NIBIB NIH HHS/United States
- 1R01EB013689-01/EB/NIBIB NIH HHS/United States
- R01 EB019458/EB/NIBIB NIH HHS/United States
- R01 EB013689/EB/NIBIB NIH HHS/United States
LinkOut - more resources
Full Text Sources
Other Literature Sources
Medical
Research Materials


