Interleukin-1 and interferon-γ orchestrate β-glucan-activated human dendritic cell programming via IκB-ζ modulation - PubMed (original) (raw)
. 2014 Dec 4;9(12):e114516.
doi: 10.1371/journal.pone.0114516. eCollection 2014.
Amiran K Dzutsev 2, Hongchuan Li 2, Nicolas Riteau 3, Franca Gerosa 4, Kevin Shenderov 3, Robin Winkler-Pickett 1, Lisa Provezza 4, Elena Riboldi 1, Robert M Leighty 5, Selinda J Orr 1, Folkert Steinhagen 1, Mark D Wewers 6, Alan Sher 3, Stephen K Anderson 2, Romina Goldszmid 1, Daniel W McVicar 1, Lyudmila Lyakh 1, Giorgio Trinchieri 7
Affiliations
- PMID: 25474109
- PMCID: PMC4256441
- DOI: 10.1371/journal.pone.0114516
Interleukin-1 and interferon-γ orchestrate β-glucan-activated human dendritic cell programming via IκB-ζ modulation
Marco Cardone et al. PLoS One. 2014.
Abstract
Recognition of microbial components via innate receptors including the C-type lectin receptor Dectin-1, together with the inflammatory environment, programs dendritic cells (DCs) to orchestrate the magnitude and type of adaptive immune responses. The exposure to β-glucan, a known Dectin-1 agonist and component of fungi, yeasts, and certain immune support supplements, activates DCs to induce T helper (Th)17 cells that are essential against fungal pathogens and extracellular bacteria but may trigger inflammatory pathology or autoimmune diseases. However, the exact mechanisms of DC programming by β-glucan have not yet been fully elucidated. Using a gene expression/perturbation approach, we demonstrate that in human DCs β-glucan transcriptionally activates via an interleukin (IL)-1- and inflammasome-mediated positive feedback late-induced genes that bridge innate and adaptive immunity. We report that in addition to its known ability to directly prime T cells toward the Th17 lineage, IL-1 by promoting the transcriptional cofactor inhibitor of κB-ζ (IκB-ζ) also programs β-glucan-exposed DCs to express cell adhesion and migration mediators, antimicrobial molecules, and Th17-polarizing factors. Interferon (IFN)-γ interferes with the IL-1/IκB-ζ axis in β-glucan-activated DCs and promotes T cell-mediated immune responses with increased release of IFN-γ and IL-22, and diminished production of IL-17. Thus, our results identify IL-1 and IFN-γ as regulators of DC programming by β-glucan. These molecular networks provide new insights into the regulation of the Th17 response as well as new targets for the modulation of immune responses to β-glucan-containing microorganisms.
Conflict of interest statement
Competing Interests: All of the authors have declared that no competing interests exist. Coauthors Amiran K. Dzutsev and Hongchuan Li are employed by Leidos Biomedical Research, Inc. and Robert M. Leighty by Data Management Services, Inc. They work under contract from the Cancer Research Center, NCI, NIH. This does not alter the authors' adherence to PLOS ONE policies on sharing data and materials.
Figures
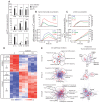
Figure 1. Gene expression in β-glucan-stimulated human DCs.
(A) Human monocyte-derived DCs were cultured for 24 h with or without particulate β-glucan or LPS. Protein secretion was measured by ELISA in culture supernatants. Results are mean ± SEM, n = 12 to 31. Statistics: Wilcoxon signed-rank test (TNF, IL-6, IL-12p40, and IL-10) or Tobit model analysis (IL-1β, IL-23, IL-1α, IL-18, and IL-12p70). (B and C) Human monocyte-derived DCs were cultured in the presence (solid lines) or absence (dashed lines) of particulate β-glucan for the times shown. Transcript accumulation was determined by absolute Real-Time qRT-PCR using total RNA and primers detecting mature transcripts (Table S2 in File S1). Protein secretion was measured by ELISA in the culture supernatants. Results are mean, n = 6 to 8 for transcripts, n = 5 to 13 for proteins. (D) Gene expression in human monocyte-derived DCs was evaluated by microarrays after activation with β-glucan for the indicated times. The heat map shows differentially expressed [≥2-fold change in expression (FDR <0.1) in at least one time point compared to the pre-stimulation level] genes (rows) in cells from three different donors (columns). The mRNA profiles were hierarchically clustered and subdivided into six groups (leftmost column of each heat map) according to the time when β-glucan controlled their expression. (E) Cluster models (Cluster ONE Cytoscape plugin) illustrating the pathways associated with the 3 groups of genes induced by β-glucan (GO pathway analysis) (left panels) and their predicted TFs (TRANSFAC database) (right panels). Each node of the pathway clusters depicts a single pathway. Similar pathways were grouped under a single representative name. Each node of the TF clusters indicates a redundant name or a predicted binding site for the listed TFs. The size of the nodes indicates the significance of the association of the pathway or the potential binding site for a TF.
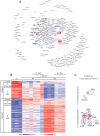
Figure 2. Gene expression in β-glucan-stimulated human DCs and its modulation by IL-1RA.
(A) The gene expression data in Figure 1D were analyzed using the Ingenuity data set. The list of genes from groups 4 and 5 in Figure 1D was used to identify the potential regulators, whereas the genes in groups 5 and 6 were examined as potential targets. The cluster model shown (Cluster ONE Cytoscape plugin) illustrates predicted regulators (marked symbols in red circles) of the gene signature (small symbols) induced by β-glucan in monocyte-derived DCs. The dimensions of the red circles are proportionate to the predicted impact of the candidate regulators in the response to β-glucan. (B) Gene expression (microarrays) in human monocyte-derived DCs activated with β-glucan with or without IL-1RA (2.5 µg/ml) for the indicated times. The heat map includes the mRNA profiles of differentially expressed [≥2-fold change in expression (FDR<0.1) in the presence or absence of IL-1RA] genes (rows) in cells from three different donors (columns). The mRNA profiles were hierarchically clustered and then subdivided into six groups (leftmost column) according to the time when β-glucan controls their expression. (C) Cluster models with predicted TFs for the genes in groups 4, 5, and 6 repressed or promoted by IL-1.
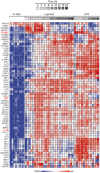
Figure 3. Expression profiles of immunoregulatory genes in DCs activated by β-glucan or LPS.
Human monocyte-derived DCs were cultured in the presence or absence of particulate β-glucan or LPS for the times shown. mRNA levels in cell lysates for 64 selected genes were quantitated by NanoString's nCounter technology. The gene symbols are listed in the leftmost column of the heat map. Technical replicates were collapsed and genes hierarchically clustered (rows, genes; columns, donors). Data from individual donors are expressed as fold change between the mRNA counts of each condition and the corresponding average levels of mRNA (baseline) across donors, times, and treatments.
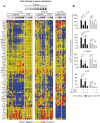
Figure 4. Regulation of the DC response to β-glucan or LPS by IL-1, TNF, and IFN-I.
(A) Human monocytes-derived DCs were stimulated with particulate β-glucan or LPS, in the presence or absence of IL-1RA (25 µg/ml) or the indicated neutralizing antibodies, for the times shown. mRNA levels in cell lysates for 64 selected genes were quantitated by NanoString's nCounter technology. The gene symbols are listed in the leftmost column of the heat map. Technical replicates were collapsed and genes hierarchically clustered (rows, genes; columns, donors). Results from individual donors were analyzed as fold change between the mRNA counts of each condition and the corresponding average levels of mRNA (baseline) across donors, times, and treatments. Final data are expressed as fold change between the mRNA counts of each condition and the corresponding baseline mRNA counts from the same cells in the absence of IL-1RA or antibodies (red, stimulation from baseline; blue, inhibition from baseline; yellow, unchanged from baseline). The heat map reports the results with all the genes analyzed by NanoString technology. The data for all the comparisons were analyzed by one-way ANOVA model using Methods of Moments . The modulated genes mentioned in the text are those in which the changes induced by the perturbations were significant (p<0.05) at least at 12 h post-stimulation. (B) Human monocyte-derived DCs were cultured for 24 h as in (A). Protein secretion in the culture supernatants was measured by ELISA. Results are mean ± SEM, n = 5 to 10. Statistics: paired t-test when measurements were uncensored or the Tobit model analysis in presence of left-censored data.
Figure 5. IL-1-mediated transcriptional regulation of β-glucan-induced late immunoregulatory cytokines in human DCs.
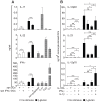
(A) Human monocyte-derived DCs were cultured with or without particulate β-glucan and IL-1RA (2.5 µg/ml). Transcript accumulation was determined by absolute Real-Time qRT-PCR using total RNA and primers (Table S2 in File S1) for the detection of either primary or mature transcripts. Results are mean, n = 4. The times when significant differences were found as well as their p values are indicated in the figure. (B) Human monocyte-derived DCs were cultured in the presence or absence of particulate β-glucan and IL-1RA (25 µg/ml) for 6 h. ChIP was performed using sheared chromatin from fixed cells. DNA-protein complexes were immunoprecipitated with control IgG or RNAPII antibody (anti-RNAPII). Eluted DNA was analyzed by Real-Time qRT-PCR using primers (Table S2 in File S1) specific for IL6, IL12B, and IL23A promoter regions, proximal to the transcription start site. Results are mean ± SEM, n = 4. Statistics: paired t-test.
Figure 6. Regulation of the DC response to β-glucan by the IL-1-induced nuclear factor IκB-ζ.
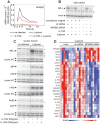
(A) Human monocyte-derived DCs were cultured with or without particulate β-glucan and/or IL-1RA (25 µg/ml). Gene expression data are from the experiment of Figure 4A and results shown are normalized mRNA counts from technical triplicates from one representative donor out of 8 analyzed. (B) Human monocyte-derived DCs were cultured for 12 h in the indicated condition. IL-1RA was used at 250 µg/ml. Total extracts were analyzed by Western blotting with the indicated antibodies. Data shown are from one representative donor out of 9 tested. Arrows indicate specific bands, while asterisks show nonspecific bands. (C) Human monocyte-derived DCs were cultured in the presence or absence of particulate β-glucan and/or IL-1RA as indicated for 6 h and nuclear extracts prepared for Western blotting. Data are from one donor and are representative of those obtained in at least 3 independent experiments with cells from different donors. Arrows indicate specific bands, while asterisks nonspecific bands. (D) Human monocyte-derived DCs from different donors were stimulated for 12 h with β-glucan in presence of transfection reagent (none) after pre-incubation with a non-targeting siRNA pool (ctr siRNA) or a pool of four siRNA directed against NFKBIZ (NFBIZ siRNA). mRNA levels in cell lysates for 64 selected genes were quantitated by NanoString's nCounter technology and the map shows genes with significant changes in expression (FDR<0.1) following knockdown of NFKBIZ. Results are expressed as in Figure 3.
Figure 7. Regulation of the IL-1-induced activity of the human IL23A promoter by IκB-ζ.
(A) Schematic representation of the human IL23A gene and strategy for the preparation of pGL3 luciferase reporter vectors under the control of different lengths of wild type or mutated IL23A 5′ upstream promoter sequences. The major predicted binding sites for TFs are depicted. (B) HeLa cells were transfected with a basic pcDNA3.1 plasmid, pcDNA(Basic), or a pcDNA(NFKBIZ) along with pGL3 luciferase reporter vectors under the control of different lengths of wild type or NF-κB-mutant promoter of IL23A. At 24 h after transfection, cells were treated with IL-1β. Luciferase activity was read in cell lysates after 48 h of stimulation. Data were normalized to TK-Renilla activity and expressed relative to the normalized activity of the Basic vector or as mean fold change ± SEM in normalized luciferase activity induced by the pcDNA(NFKBIZ) with respect to the control vector pcDNA(Basic) to highlight the _NFKBIZ_-stimulated luciferase activity from each reporter vector shown. Results are mean ± SEM, n = 6.
Figure 8. Regulation of DC-promoted Th cell responses to β-glucan by IFN-γ.
(A) Human monocyte-derived DCs, unprimed (DCs) or primed overnight with IFN-γ (IFN-γ-DCs), were washed extensively and cultured in the presence or absence of β-glucan for 24 h. Culture supernatants (spn) were used to polarize freshly isolated naïve CD45RO-CD4+ T lymphocytes in presence of anti-CD3 and anti-CD28 antibodies. After 4 d, T cells were washed and stimulated with anti-CD3 and PMA for further 18 h. As controls, naïve T cells were also differentiated with optimal combinations of immunoregulatory cytokines into Th17, Th22, and Th1 cells as described in Materials and Methods S1 in File S2. Cytokine secretion was measured by ELISA. Results are mean ± SEM using monocyte-derived DC supernatants from 4 donors, each tested on T cells from 4 different donors. Statistics: Wilcoxon signed-rank test. (B) Human monocyte-derived DCs, unprimed or primed overnight with IFN-γ were stimulated or not for 24 h with β-glucan, IL-1RA (250 µg/ml) and/or IL-1β as indicated. Protein secretion in the culture supernatants was measured by ELISA. Results are mean ± SEM, n = 6 to 9. Statistics: paired t-test when measurements were uncensored or Tobit model analysis in presence of left-censored data.
Figure 9. IFN-γ-mediated regulation of immune response to β-glucan via inhibition of IL-1β and IκB-ζ in activated DCs.
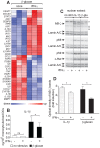
(A) Human monocyte-derived DCs, unprimed or primed overnight with IFN-γ were stimulated or not for 12 h with β-glucan as indicated. mRNA levels in cell lysates for 64 selected genes were quantitated by NanoString's nCounter technology and the map shows genes with significant changes in expression (FDR<0.1) upon IFN-γ. Results from 3 different donors are expressed as in Figure 3. (B) Human monocyte-derived DCs, unprimed or primed overnight with IFN-γ were stimulated or not for 24 h with β-glucan as indicated. Protein secretion in the culture supernatants was measured by ELISA. Results are mean ± SEM, n = 7. Statistics: Tobit model analysis. (C) Human monocyte-derived DCs, unprimed or primed overnight with IFN-γ were cultured in the presence or not of particulate β-glucan as indicated for 6 h and nuclear extracts prepared for Western blotting. Data are from one donor and are representative of those obtained in at least 3 independent experiments with cells derived from different donors. Arrows indicate specific bands, while asterisks nonspecific bands. (D) Optical density of nuclear IκB-ζ bands from Western blotting analysis in (C). Data shown are fold induction over background from unstimulated cells. Results are mean ± SEM, n = 3. Statistics: t-test.
Similar articles
- Galectin-3 modulates Th17 responses by regulating dendritic cell cytokines.
Fermin Lee A, Chen HY, Wan L, Wu SY, Yu JS, Huang AC, Miaw SC, Hsu DK, Wu-Hsieh BA, Liu FT. Fermin Lee A, et al. Am J Pathol. 2013 Oct;183(4):1209-1222. doi: 10.1016/j.ajpath.2013.06.017. Epub 2013 Aug 3. Am J Pathol. 2013. PMID: 23916470 Free PMC article. - IFN-beta inhibits human Th17 cell differentiation.
Ramgolam VS, Sha Y, Jin J, Zhang X, Markovic-Plese S. Ramgolam VS, et al. J Immunol. 2009 Oct 15;183(8):5418-27. doi: 10.4049/jimmunol.0803227. Epub 2009 Sep 25. J Immunol. 2009. PMID: 19783688 - Beta-(1-->3)-D-glucan modulates DNA binding of nuclear factors kappaB, AT and IL-6 leading to an anti-inflammatory shift of the IL-1beta/IL-1 receptor antagonist ratio.
Luhm J, Langenkamp U, Hensel J, Frohn C, Brand JM, Hennig H, Rink L, Koritke P, Wittkopf N, Williams DL, Mueller A. Luhm J, et al. BMC Immunol. 2006 Mar 22;7:5. doi: 10.1186/1471-2172-7-5. BMC Immunol. 2006. PMID: 16553947 Free PMC article. - Genetic and Epigenetic Regulation of the Innate Immune Response to Gout.
de Lima JD, de Paula AGP, Yuasa BS, de Souza Smanioto CC, da Cruz Silva MC, Dos Santos PI, Prado KB, Winter Boldt AB, Braga TT. de Lima JD, et al. Immunol Invest. 2023 Apr;52(3):364-397. doi: 10.1080/08820139.2023.2168554. Epub 2023 Feb 6. Immunol Invest. 2023. PMID: 36745138 Review. - Regulation of interleukin-12/interleukin-23 production and the T-helper 17 response in humans.
Lyakh L, Trinchieri G, Provezza L, Carra G, Gerosa F. Lyakh L, et al. Immunol Rev. 2008 Dec;226:112-31. doi: 10.1111/j.1600-065X.2008.00700.x. Immunol Rev. 2008. PMID: 19161420 Free PMC article. Review.
Cited by
- Shaping the Innate Immune Response by Dietary Glucans: Any Role in the Control of Cancer?
Del Cornò M, Gessani S, Conti L. Del Cornò M, et al. Cancers (Basel). 2020 Jan 8;12(1):155. doi: 10.3390/cancers12010155. Cancers (Basel). 2020. PMID: 31936360 Free PMC article. Review. - IL-27 Induced by Select Candida spp. via TLR7/NOD2 Signaling and IFN-β Production Inhibits Fungal Clearance.
Patin EC, Jones AV, Thompson A, Clement M, Liao CT, Griffiths JS, Wallace LE, Bryant CE, Lang R, Rosenstiel P, Humphreys IR, Taylor PR, Jones GW, Orr SJ. Patin EC, et al. J Immunol. 2016 Jul 1;197(1):208-21. doi: 10.4049/jimmunol.1501204. Epub 2016 Jun 3. J Immunol. 2016. PMID: 27259855 Free PMC article. - IL-1 Receptor Signaling on Graft Parenchymal Cells Regulates Memory and De Novo Donor-Reactive CD8 T Cell Responses to Cardiac Allografts.
Iida S, Tsuda H, Tanaka T, Kish DD, Abe T, Su CA, Abe R, Tanabe K, Valujskikh A, Baldwin WM 3rd, Fairchild RL. Iida S, et al. J Immunol. 2016 Mar 15;196(6):2827-37. doi: 10.4049/jimmunol.1500876. Epub 2016 Feb 8. J Immunol. 2016. PMID: 26856697 Free PMC article. - The network interplay of interferon and Toll-like receptor signaling pathways in the anti-Candida immune response.
Salgado RC, Fonseca DLM, Marques AHC, da Silva Napoleao SM, França TT, Akashi KT, de Souza Prado CA, Baiocchi GC, Plaça DR, Jansen-Marques G, Filgueiras IS, De Vito R, Freire PP, de Miranda GC, Camara NOS, Calich VLG, Ochs HD, Schimke LF, Jurisica I, Condino-Neto A, Cabral-Marques O. Salgado RC, et al. Sci Rep. 2021 Oct 13;11(1):20281. doi: 10.1038/s41598-021-99838-0. Sci Rep. 2021. PMID: 34645905 Free PMC article. - Regulation and Function of the Atypical IκBs-Bcl-3, IκBNS, and IκBζ-in Lymphocytes and Autoimmunity.
Kübelbeck T, Wichmann NO, Raj T, Raj C, Ohnmacht C, Hövelmeyer N, Kramer D, Heissmeyer V. Kübelbeck T, et al. Eur J Immunol. 2025 May;55(5):e202451273. doi: 10.1002/eji.202451273. Eur J Immunol. 2025. PMID: 40359334 Free PMC article. Review.
References
- Takeuchi O, Akira S (2010) Pattern recognition receptors and inflammation. Cell 140:805–820. - PubMed
- Steinman RM, Banchereau J (2007) Taking dendritic cells into medicine. Nature 449:419–426. - PubMed
Publication types
MeSH terms
Substances
Grants and funding
- 099953/WT_/Wellcome Trust/United Kingdom
- HHSN261200800001C/RC/CCR NIH HHS/United States
- HHSN261200800001E/CA/NCI NIH HHS/United States
- T32 GM007309/GM/NIGMS NIH HHS/United States
LinkOut - more resources
Full Text Sources
Other Literature Sources
Molecular Biology Databases
