Monocyte recruitment to the dermis and differentiation to dendritic cells increases the targets for dengue virus replication - PubMed (original) (raw)
Monocyte recruitment to the dermis and differentiation to dendritic cells increases the targets for dengue virus replication
Michael A Schmid et al. PLoS Pathog. 2014.
Abstract
Dengue virus (DENV) causes the most prevalent arthropod-borne viral disease in humans. Although Aedes mosquitoes transmit DENV when probing for blood in the skin, no information exists on DENV infection and immune response in the dermis, where the blood vessels are found. DENV suppresses the interferon response, replicates, and causes disease in humans but not wild-type mice. Here, we used mice lacking the interferon-α/β receptor (Ifnar(-/-)), which had normal cell populations in the skin and were susceptible to intradermal DENV infection, to investigate the dynamics of early DENV infection of immune cells in the skin. CD103(+) classical dendritic cells (cDCs), Ly6C(-) CD11b(+) cDCs, and macrophages in the steady-state dermis were initial targets of DENV infection 12-24 hours post-inoculation but then decreased in frequency. We demonstrated recruitment of adoptively-transferred Ly6C(high) monocytes from wild-type and Ifnar(-/-) origin to the DENV-infected dermis and differentiation to Ly6C(+) CD11b(+) monocyte-derived DCs (moDCs), which became DENV-infected after 48 hours, and were then the major targets for virus replication. Ly6C(high) monocytes that entered the DENV-infected dermis expressed chemokine receptor CCR2, likely mediating recruitment. Further, we show that ∼ 100-fold more hematopoietic cells in the dermis were DENV-infected compared to Langerhans cells in the epidermis. Overall, these results identify the dermis as the main site of early DENV replication and show that DENV infection in the skin occurs in two waves: initial infection of resident cDCs and macrophages, followed by infection of monocytes and moDCs that are recruited to the dermis. Our study reveals a novel viral strategy of exploiting monocyte recruitment to increase the number of targets for infection at the site of invasion in the skin and highlights the skin as a potential site for therapeutic action or intradermal vaccination.
Conflict of interest statement
The authors have declared that no competing interests exist.
Figures
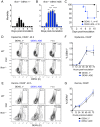
Figure 1. DENV2 infection of the skin in Ifnar –/– but not WT mice and lethal disease during ADE.
(A and B) Ifnar –/– mice were injected i.d. with DENV2 under 1° (A) or ADE (B) infection conditions. Mean morbidity +SEM on a scale from 1 = healthy to 5 = moribund. The dotted line marks the time-point 72 h, when symptoms of disease appeared. (C) Survival of i.d. DENV2-infected Ifnar –/– mice (data pooled from 3 independent experiments, n = 10 per condition). Significant differences between 1° and ADE infection conditions are marked as *, _p_≤0.05; **, _p_≤0.01; ***, _p_≤0.001; and ****, _p_≤0.0001. (D and E) Flow cytometric analysis of FSC and intracellular DENV protein E in CD45+ hematopoietic cells from the epidermis (D) and dermis (E) of WT and Ifnar –/– mice 48 hours post-i.d. inoculation (hpi) with DENV2 or PBS (2 repeats, n = 6 per condition). (F and G) Time-courses showing mean ±SEM of CD45+ hematopoietic cells in the epidermis (F) or dermis (G) of Ifnar –/– mice staining positive for intracellular DENV proteins NS3 and E, 12–72 hpi with DENV2 under 1° (black square) or ADE (blue circle) infection conditions. Data are pooled from 2–5 repeats (n = 6–13 per time-point and condition). See also Figure S1.
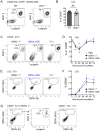
Figure 2. Frequency and DENV infection of LCs in the epidermis.
(A) Gating of LCs from CD45+ cells in the epidermis of steady-state WT and Ifnar –/– mice. (B) Bar graph showing the mean ± standard error of the mean (SEM) and single data points of the % LCs among CD45+ cells in the epidermis. (C) Gating of LCs among CD45+ cells in the epidermis of Ifnar –/– mice 24 hpi with DENV2 under 1° or ADE conditions or after inoculation with PBS. (D) Time-course showing mean % LCs ±SEM in the epidermis after i.d. inoculation with DENV2 under 1° (black square) or ADE (blue circle) infection conditions or after inoculation with PBS (grey triangle). Time-point “0” is the frequency of LCs in the steady-state untouched epidermis. Significant differences in LC frequencies between steady state and i.d. inoculation are marked as ***, _p_≤0.001, and differences for 1° or ADE DENV2 infection are marked together as they were similar. (E) Intracellular staining of LCs for DENV proteins NS3 and E 72 hpi. (F) Time-course showing % DENV+ LCs in the epidermis during 1° (black square) and ADE (blue circle) DENV infection. (G) MHC II and Langerin expression of all CD45+ cells that were gated DENV NS3+ E+ 72 hpi under 1° conditions or with PBS. Representative plots or pooled data are from 2–5 independent experiments (n = 6–15 per time-point and condition). See also Figure S2.
Figure 3. Normal cell populations in steady-state dermis of Ifnar –/– mice.
(A and B) Consecutive gating of cell populations from CD45+ cells in the dermis of steady-state WT (A) and Ifnar –/– (B) mice. Depicted ciphers in the graphs are the % of cells in the gate relative to the parent gate. (C-F) Bar graphs showing mean ±SEM and single data points of the % CD11b+ DCs (C), CD103+ cDCs (D), and Ly6Chigh monocytes (E), and MΦs (F), as gated in A and B, and calculated as frequency among all CD45+ cells in the steady-state dermis. Data are pooled from 3 independent experiments (n = 9–10 per mouse strain), and statistical comparisons between WT and Ifnar –/– mice are indicated (NS, non-significant). See also Figure S3.
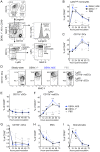
Figure 4. Dynamics of cell populations in the DENV-infected dermis.
(A) Gating of cell populations in the dermis in Ifnar –/– mice 48 hpi with DENV2 under 1° infection conditions. (B and C) Time-courses showing mean ±SEM of % Ly6Chigh monocytes (B) and CD11b+ DCs (C) among dermal CD45+ cells after i.d. inoculation with DENV2 under 1° (black square) or ADE (blue circle) infection conditions or after inoculation with PBS (grey triangle). Time-point “0” is the frequency of each cell type in steady-state untouched dermis (data from Fig. 1). (D) Ly6C expression separating CD11b+ DCs into Ly6C+ CD11b+ moDCs and Ly6C– CD11b+ cDCs in the steady-state dermis, or 48 hpi with DENV2 or PBS. (E–I) Time-courses showing mean ±SEM of % Ly6C– CD11b+ cDCs (E), Ly6C+ CD11b+ moDCs (F), CD103+ cDCs (G), MΦs (H), and granulocytes (I) among dermal CD45+ cells. Significant differences between cell frequencies in steady state and after i.d. inoculation are marked as * for _p_≤0.05; **, _p_≤0.01; ***, _p_≤0.001; and ****, _p_≤0.0001. Asterisks designate _p_-values comparing steady state to 1° or ADE DENV2 infection together as they were similar. Representative plots or pooled data are from 2–4 independent experiments (n = 6–10 per time-point and condition). See also Figure S4.
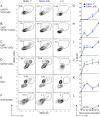
Figure 5. DENV infection of monocytes, DCs, and MΦs in the dermis.
(A–F) Ifnar –/– mice were inoculated i.d. with DENV2 during 1° or ADE infection or with PBS. Intracellular staining for DENV proteins NS3 and E is shown after 48 h. (G–L) Time-course of mean ±SEM of % NS3+ E+ DENV-infected cells for each population in the dermis under 1° (black square) or ADE (blue circle) infection conditions. Ly6Chigh monocytes (A and G), Ly6C+ CD11b+ moDCs (B and H), Ly6C– CD11b+ cDCs (C and I), CD103+ cDCs (D and J), MΦs (E and K), and granulocytes (F and L) were gated as in Fig. 4. Representative plots or pooled data are from 2–4 independent experiments (n = 6–12 per time-point and condition).
Figure 6. The main targets for DENV infection in the dermis over time.
(A and B) Stacked area charts show mean distribution of all DENV+ CD45+ cells among cell populations in the dermis 12, 24, 48, and 72 hpi with DENV2 under 1° (A) or ADE (B) infection conditions. Individual populations from top to bottom: Ly6Chigh monocytes, Ly6C+ CD11b+ moDCs, Ly6C– CD11b+ cDCs, CD103+ cDCs, MΦs, and granulocytes. The depicted area for each population represents the % DENV-infected cells for this cell type of CD45+ cells. Data are pooled from 2-4 independent experiments (n = 6–12 per time-point and condition).
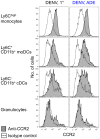
Figure 7. CCR2 expression on Ly6Chigh monocytes, moDCs, and cDCs.
Ifnar –/– mice were inoculated i.d. with DENV2 during 1° or ADE infection. CCR2 expression compared to isotype-matched control stains of Ly6Chigh monocytes, Ly6C+ CD11b+ moDCs, Ly6C– CD11b+ cDCs, and granulocytes 24 hpi with DENV under 1° or ADE conditions. Representative data from two independent experiments (n = 6 per condition).
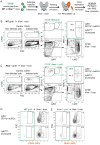
Figure 8. Ly6Chigh monocytes enter the DENV-infected dermis and differentiate to moDCs.
(A) Ly6Chigh monocytes were isolated from the bone marrow of steady-state WT and Ifnar –/– mice, labeled with CFSE, and transferred intravenously into 4 week-old Ifnar –/– recipients. After 24 h, one ear was infected with DENV2 under 1° conditions, while the other ear remained untouched. Ear skin was analyzed 48 hpi with DENV2. (B and C) Recipients obtained 6×10⁶ monocytes from WT (B) or 9×10⁶ monocytes from Ifnar –/– donors (C). Gating of CFSE+ graft and CFSE– host cells among CD45+ cells in the dermis of the infected or non-infected side. CD11b+ Ly6G– Ly6C+ and MHC II– monocytes or MHC II+ moDCs were gated as indicated. (D and E) DENV NS3 intracellular staining of Ly6C+ CD11b+ moDCs or Ly6Chigh monocytes in CFSE+ WT graft (D), CFSE+ Ifnar –/– graft (E), or CFSE– Ifnar –/– host cells (D and E). Representative plots of 2 independent experiments (n = 10 total recipients and n = 4 non-transplanted controls). See also Figure S5.
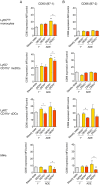
Figure 9. Expression of activation markers on Ly6Chigh monocytes, moDCs, cDCs and MΦs.
Ifnar –/– mice were inoculated i.d. with DENV2 during 1° or ADE infection. (A and B) Bar graphs show mean ±SEM of CD80 (B7-1) (A) or CD86 (B7-2) (B) surface protein expression determined via flow cytometric analysis and calculated as median fluorescence intensities (MFI) of specific stains divided by the MFI of isotype-matched control stains. CD80 and CD86 expression was examined on Ly6Chigh monocytes, Ly6C+ CD11b+ moDCs, Ly6C– CD11b+ cDCs, and MΦs during steady state, or 48 hpi with DENV under 1° or ADE conditions. In DENV-inoculated samples, each cell population was gated further on the presence of intracellular DENV proteins NS3 and E for DENV-infected cells (DENV+) or the absence of DENV proteins for non-infected bystander cells (DENV–). Significant differences in activation marker expression after i.d. inoculation with DENV compared to steady state are marked as * for _p_≤0.05 and ** for _p_≤0.01 above individual bars. Significant differences between DENV– and DENV+ within the same sample are marked between bars with brackets and were calculated using the paired _t_-test. Pooled data from two independent experiments (n = 6 per condition).
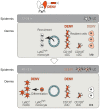
Figure 10. The two waves of DENV infection in the skin.
Using a novel i.d. DENV infection model in the ear of Ifnar –/– mice, DENV was shown to initially infect resident cells of the dermis, most importantly Ly6C– CD11b+ cDCs at 12–24 hpi. DENV also infects dermal CD103+ cDCs and to a lower extent MΦs, which decrease in frequency compared to steady state (top panel). At the same time, Ly6Chigh monocytes are recruited from the blood to the DENV-infected dermis, where they differentiate to Ly6C+ CD11b+ moDCs, which become the major targets for DENV infection in a second wave of replication between 48–72 hpi (bottom panel). DENV infects approximately 100-fold more hematopoietic cells in the dermis than LCs in the epidermis.
Similar articles
- Aedes aegypti Mosquito Probing Enhances Dengue Virus Infection of Resident Myeloid Cells in Human Skin.
Castanha PMS, Azar SR, Yeung J, Wallace M, Kettenburg G, Watkins SC, Marques ETA, Vasilakis N, Barratt-Boyes SM. Castanha PMS, et al. Viruses. 2024 Aug 5;16(8):1253. doi: 10.3390/v16081253. Viruses. 2024. PMID: 39205228 Free PMC article. - Crosstalk Between Dermal Fibroblasts and Dendritic Cells During Dengue Virus Infection.
Montes-Gómez AE, García-Cordero J, Marcial-Juárez E, Shrivastava G, Visoso-Carvajal G, Juárez-Delgado FJ, Flores-Romo L, Sanchez-Torres MC, Santos-Argumedo L, Bustos-Arriaga J, Cedillo-Barrón L. Montes-Gómez AE, et al. Front Immunol. 2020 Oct 23;11:538240. doi: 10.3389/fimmu.2020.538240. eCollection 2020. Front Immunol. 2020. PMID: 33193307 Free PMC article. - Differential migration of epidermal and dermal dendritic cells during skin infection.
Eidsmo L, Allan R, Caminschi I, van Rooijen N, Heath WR, Carbone FR. Eidsmo L, et al. J Immunol. 2009 Mar 1;182(5):3165-72. doi: 10.4049/jimmunol.0802950. J Immunol. 2009. PMID: 19234214 - Mechanisms of monocyte cell death triggered by dengue virus infection.
Castillo JA, Urcuqui-Inchima S. Castillo JA, et al. Apoptosis. 2018 Dec;23(11-12):576-586. doi: 10.1007/s10495-018-1488-1. Apoptosis. 2018. PMID: 30267240 Review. - Dendritic cells in dengue virus infection: targets of virus replication and mediators of immunity.
Schmid MA, Diamond MS, Harris E. Schmid MA, et al. Front Immunol. 2014 Dec 17;5:647. doi: 10.3389/fimmu.2014.00647. eCollection 2014. Front Immunol. 2014. PMID: 25566258 Free PMC article. Review.
Cited by
- Insight into the Tropism of Dengue Virus in Humans.
Begum F, Das S, Mukherjee D, Mal S, Ray U. Begum F, et al. Viruses. 2019 Dec 9;11(12):1136. doi: 10.3390/v11121136. Viruses. 2019. PMID: 31835302 Free PMC article. Review. - CyTOF Profiling of Zika and Dengue Virus-Infected Human Peripheral Blood Mononuclear Cells Identifies Phenotypic Signatures of Monotype Subsets and Upregulation of the Interferon-Inducible Protein CD169.
Fenutria R, Maringer K, Potla U, Bernal-Rubio D, Evans MJ, Harris E, Rahman AH, Fernandez-Sesma A, Ramos I. Fenutria R, et al. mSphere. 2021 Jun 30;6(3):e0050521. doi: 10.1128/mSphere.00505-21. Epub 2021 Jun 23. mSphere. 2021. PMID: 34160241 Free PMC article. - CCR2 Deficiency Impairs Ly6Clo and Ly6Chi Monocyte Responses in Orientia tsutsugamushi Infection.
Petermann M, Orfanos Z, Sellau J, Gharaibeh M, Lotter H, Fleischer B, Keller C. Petermann M, et al. Front Immunol. 2021 Jul 5;12:670219. doi: 10.3389/fimmu.2021.670219. eCollection 2021. Front Immunol. 2021. PMID: 34290699 Free PMC article. - The Dynamic Relationship between Dengue Virus and the Human Cutaneous Innate Immune Response.
Martí MM, Castanha PMS, Barratt-Boyes SM. Martí MM, et al. Viruses. 2024 May 4;16(5):727. doi: 10.3390/v16050727. Viruses. 2024. PMID: 38793609 Free PMC article. Review.
References
- Pasparakis M, Haase I, Nestle FO (2014) Mechanisms regulating skin immunity and inflammation. Nat Rev Immunol 14: 289–301. - PubMed
Publication types
MeSH terms
Substances
LinkOut - more resources
Full Text Sources
Other Literature Sources
Medical
Molecular Biology Databases
Research Materials
