A constant size extension drives bacterial cell size homeostasis - PubMed (original) (raw)
A constant size extension drives bacterial cell size homeostasis
Manuel Campos et al. Cell. 2014.
Abstract
Cell size control is an intrinsic feature of the cell cycle. In bacteria, cell growth and division are thought to be coupled through a cell size threshold. Here, we provide direct experimental evidence disproving the critical size paradigm. Instead, we show through single-cell microscopy and modeling that the evolutionarily distant bacteria Escherichia coli and Caulobacter crescentus achieve cell size homeostasis by growing, on average, the same amount between divisions, irrespective of cell length at birth. This simple mechanism provides a remarkably robust cell size control without the need of being precise, abating size deviations exponentially within a few generations. This size homeostasis mechanism is broadly applicable for symmetric and asymmetric divisions, as well as for different growth rates. Furthermore, our data suggest that constant size extension is implemented at or close to division. Altogether, our findings provide fundamentally distinct governing principles for cell size and cell-cycle control in bacteria.
Copyright © 2014 Elsevier Inc. All rights reserved.
Figures
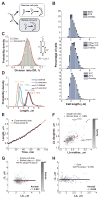
Figure 1. Cell length control in C. crescentus
(A) Schematic of the dimorphic cell cycle of C. crescentus. Each division generates two different progeny: the smaller swarmer cell and the longer stalked cell. The swarmer cell is motile thanks to a polar flagellum until the cell transitions to a stalked cell. (B) Distribution of C. crescentus CB15N lengths under different environmental conditions. Cells were grown in M2G at 30°C and imaged on 1% agarose pads at an OD660nm < 0.3 except if stated otherwise. (C) Histogram representing the distribution of the division ratio DR for C. crescentus CB15N cells (n = 706) grown in M2G medium and imaged on 0.3% agarose pads. (D) Distribution of cell length at birth Lb, and at division Ld for stalked cells (n = 565) and swarmer cells (n = 141) grown in M2G medium at 30°C and imaged at OD660nm < 0.3 on 0.3% agarose pads. The coefficient of variation (SD/mean) for each distribution is shown. (E) Representative growth curve of a single stalked cell (black circles) grown in M2G medium at 30°C on a 0.3% agar pad. The red line is the best fit of the data with an exponential function. (F) Partial inheritance of Lb from one generation to the next (n = 457 stalked cells). The vertical and horizontal dotted lines indicate the mean length at birth for mother and daughter cells. The line y = x is also plotted for comparison purposes. (G) Dependence of the elongation over a cell cycle (ΔL) on Lb for stalked cells. Grey dots represent single-cell data while orange dots represent the average of binned data ± SEM (standard error of the mean). The shade of grey represents the density of points in a given area of the graph. The black line represents the linear fit to the single-cell data. (H) Dependence of ΔL on Lb for swarmer cells. There were not enough cells (n = 141) to bin the data. See also Figure S5, S7 and Movie S1.
Figure 2. Steady-state growth of E. coli BW25113 cells in microfluidic chambers
E. coli BW25113 cells (n = 1,305) were grown in microfluidic chambers at 30°C in nutrient-rich LB medium. (A) Relative growth rate α over the course of the >7h-long microfluidic experiment. Grey dots represent single-cell data while orange dots represent the average of binned data ± SEM. (B) Same as panel A, except that Lb was plotted instead of α. (C) Representative growth curve of a single cell (black circles). Length was measured every 5 sec. The red line is the best fit of the data with an exponential function. (D) Distribution of Lb, and Ld. (E) Partial inheritance of Lb from one generation to the next. (F) Dependence of ΔL on Lb. The black line represents the linear fit to the single-cell data. See also Figures S1, S2, S5, S7 and Movie S2.
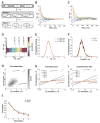
Figure 3. Cell size control by a constant extension model
(A) Schematic showing how a constant elongation allows cells of below- and above-average length to recover over time and generations. (B) Analytical dependence of Lb on time for 10 cells with Lb ranging from 1 to 10 μm. The time between data points represents the cell cycle (generation) time for that particular cell. See Table S1 for input parameter values. (C) Same as panel B except that the experimentally observed fluctuations around the DR, α and ΔL mean values were added to the simulation. (D) Evolution of Lb for 500 simulated cells with initially wide distribution of lengths. (E) Plot showing the distribution of Lb at the three time points indicated by the grey dashed lines in panel D. All cells present at the indicated times were considered to build the Lb distributions. (F) Plots showing the Lb distributions obtained from experiment and simulation (see Table S1 for input parameter values). (G) Plot showing the dependence in Lb between mother and daughter cells. The data were obtained from a stochastic simulation of the constant extension model using the same number of cells (n = 1,305) as in the experiment shown in Figure 2. (H) Degree of inheritance of Lb over 1 to 5 generations in simulations. Each line represents the best linear fit to the single-cell data of Lb for an ancestor and its descendant from the first to fifth generation. (I) Same plot as in panel H except that the data were derived from the experiment for E. coli LB experiment. (J) Evolution of the correlation between Lb from ancestors to descendants over generation expected from the model (black) or observed experimentally (red). The correlation was based on linear regressions of single-cell data. The error bars represent the 95% confidence interval around the slope value. See also Figure S3 and S5.
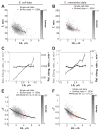
Figure 4. Cells correct their length at birth by modulating their cell cycle time and not their relative growth rate
(A) Dependence of the cell cycle time T on Lb for E. coli grown in LB medium (n = 1,305 cells). (B) Same as panel A but for C. crescentus stalked cells grown in M2G medium (n = 565 cells). (C) Dependence of the absolute (grey) and relative (black) elongation rate α on Lb for E. coli. (D) Same as panel C but for C. crescentus. (E) Dependence of the normalized cell cycle time αT on Lb for E. coli. The black line represents the expected average αT from the constant extension model as described by the equation αT = ln(1+Δ_L_/Lb). The black line was drawn using the average Δ_L_ value measured experimentally. (F) Same as panel E but for C. crescentus.
Figure 5. E. coli also controls its length through a constant elongation in M9 supplemented medium
(A) Distribution of Lb and Ld of BW25113 cells (n = 1,528) grown in M9 supplemented medium at 32°C in a microfluidic chamber over 6 h. (B) Partial inheritance of Lb from one generation to the next. (C) Dependence of ΔL on Lb. The black line represents the linear fit to the single-cell data. (D) Experimental and simulated Lb distributions. ‘No corr’, ‘α-α’ and ‘α-α + ΔL_-α’ refer to the type of correlations included in the simulations (as described in SI). (E) Phase contrast images of BW25113 wild type, Δ_pstH and Δ_ptsI_ grown in M9 supplemented medium in liquid cultures and spotted on 1% agarose pads. The scale bars represents 2 μm. (F) Cell length distributions of wild-type, Δ_pstH_ and Δ_ptsI_ populations. See also Figure S4 and S5.
Figure 6. Testing the phase-shifted constant extension model
(A) Schematic of the constant extension model in which the division cycle (black bracket) is in phase with the constant elongation cycle (red bracket). The event under cell cycle control (green crosses) is division D. (B) Schematic of the ‘phase-shifted’ model with a timer δt < _T._ In this model, the elongation increment (_ΔL*_) is applied to a cell cycle event X (green crosses) that is coupled to division by a timer _δt_ shorter than the interdivision time _T_. (C) Schematic representation of the ‘phase-shifted’ constant extension model with _δt_ > T and with the constraint of a single event X per division cycle (see SI and Table S1). (D) Simulations of the ‘phase-shifted’ model with a timer δt < _T_ (see SI and Table S1). The Kendall correlation coefficient between _Lb_ and _ΔL_ depends on how early in the cell cycle the timer _δt_ starts. Shown is the mean ± standard deviation of 10 simulations performed with 1,500 cells for _DR_ = 0.56. (E) Simulations of the ‘phase-shifted’ model with a timer _δt_ > T. Shown is a scatter plot of ΔL (from birth to division) for 500 simulated cells at each generation. (F) Same as (E), but plot showing the distribution of ΔL at the time indicated by the dashed line in panel E. See also Figure S6.
Figure 7. The constant extension mechanism is robust with respect to the cell length and division site placement
E. coli BW25113 Δ_minC_ cells were grown in microfluidic chambers at 30°C in M9 supplemented medium over 5.5 h. (A) Dependence of ΔL on Lb (n = 959 cells). Grey dots represent single-cell data while orange dots represent the average of binned data ± SEM. (B) Degree of inheritance of ΔL over one generation (n = 510 cells). (C) Dependence of the cell cycle time T on Lb (n = 959 cells). The black line represents the expected average αT from the constant elongation model as described by the equation T = ln(1+Δ_L_/Lb)/α. The black line was drawn using the average Δ_L_ and α values measured experimentally. (D) Dependence of ΔL on DR. (E) Distributions of length extensions for wild-type and Δ_minC_ cells. (F) Cell length distributions of BW25113 Δ_minC_ cells grown in separate 2-mL liquid cultures in M9 supplemented medium. See also Movie S3.
References
- Amir A. Cell Size Regulation in Bacteria. Phys Rev Lett. 2014:112.
Publication types
MeSH terms
Grants and funding
- R01 GM065835/GM/NIGMS NIH HHS/United States
- T32 GM007223/GM/NIGMS NIH HHS/United States
- 5 T32 GM 7223-39/GM/NIGMS NIH HHS/United States
- Howard Hughes Medical Institute/United States
LinkOut - more resources
Full Text Sources
Other Literature Sources


